Satisfaction by location: how to measure several stores with one survey
A chain with four stores and an overall NPS of +18 looks fine. Until you split by store and see two of them above +30 and one below zero. The average was hiding exactly what needed fixing.
One survey for every location
As with teacher evaluations, use a single survey with the location as the first question instead of one survey per store. The questions stay identical and comparing is direct.
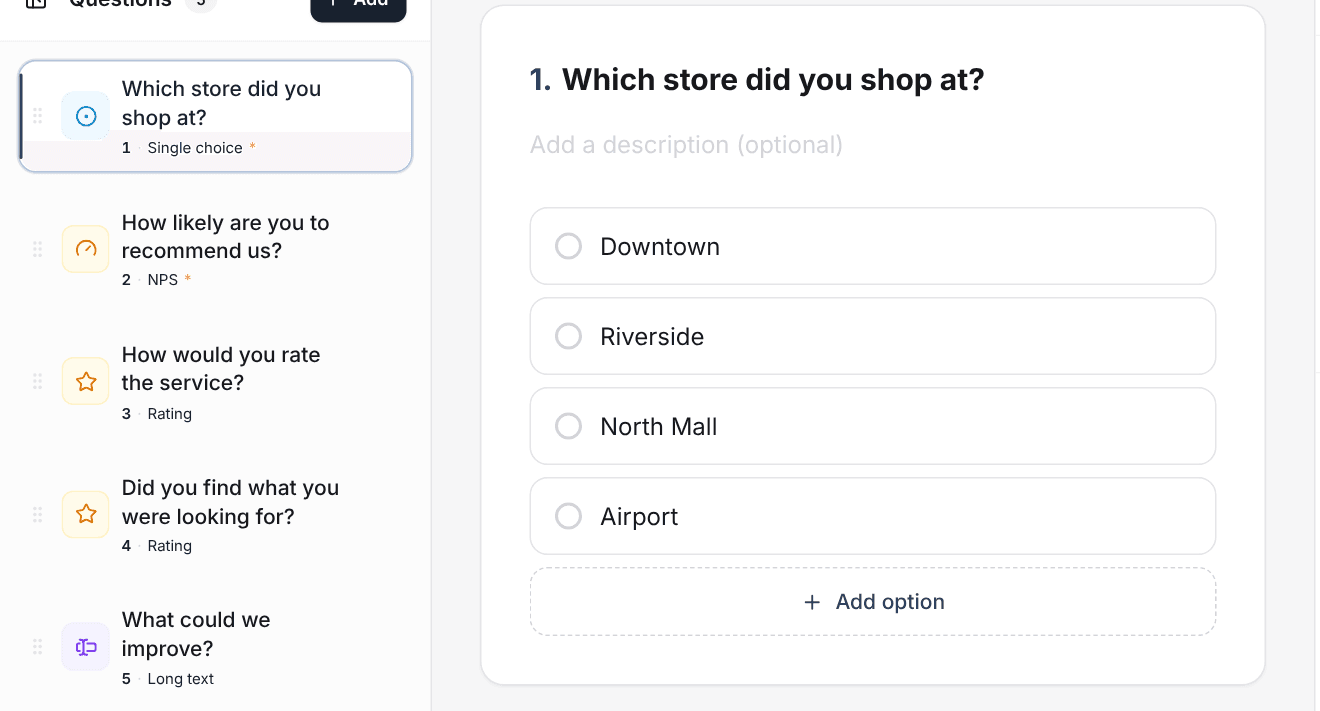
To get answers, the simplest option is a QR code at the register or on the receipt. Five questions at most: the customer is on their way out.
- Which store did you shop at?
- How likely are you to recommend us? (0 to 10).
- How would you rate the service? (1 to 5).
- Did you find what you were looking for? (1 to 5).
- What could we improve?
How many responses each store needs
What matters is not the total but how many responses each location has. With 600 responses a month across five stores, the smallest one may get 14. And with 14 responses, that store's NPS can jump 20 or 30 points from one month to the next with nothing actually changing.
Monthly responses per store. With 14 responses, Harbor's score can swing a lot from month to month: look at its trend before drawing conclusions.
As a rule of thumb, aim for at least 30 responses per store before comparing, and 100 or more if you want to spot small differences. If a store falls short, combine two or three months before drawing conclusions.
Comparing stores
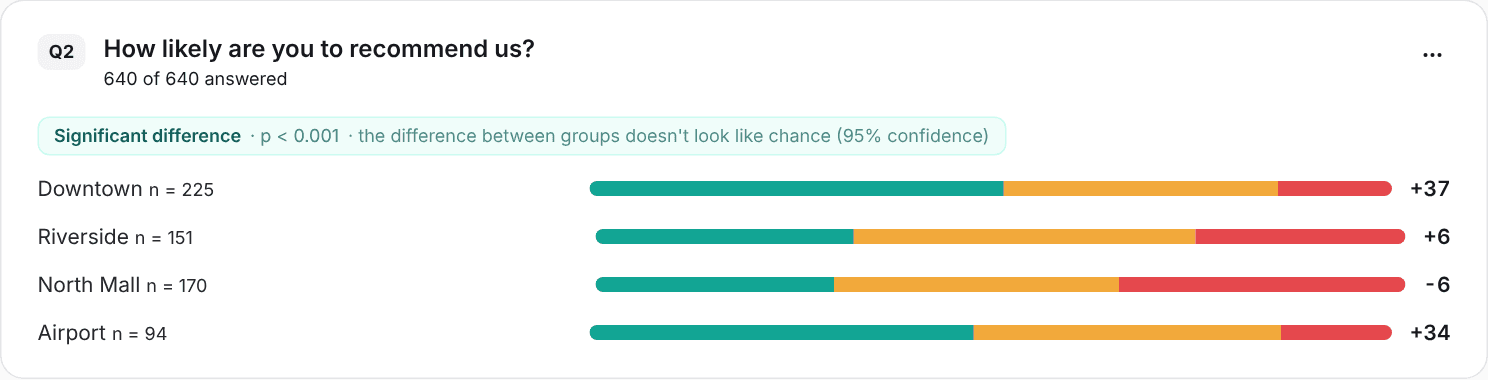
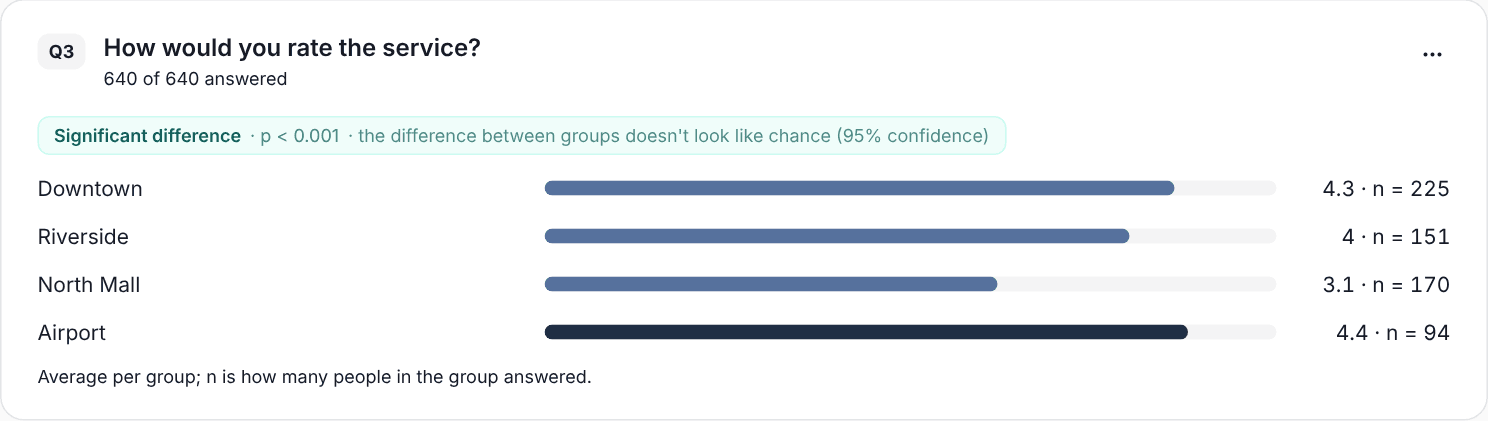
When a store scores low, look at the other questions to find out why. In this example, service explains a good part of the gap, and the open comments mention slow checkout.
Let each manager see their own
- Share each store's results and comments with its manager.
- Show the month-by-month trend, not just this month's snapshot.
- Celebrate improvement, not only the top spots: a store going from +5 to +20 did more work than one that stays at +40.