Teacher evaluation by students: how to run it across many courses without losing detail
A teacher evaluation looks like a small survey until you do the math. A school or academy with 120 students, each taking 5 courses, ends up with 600 evaluations per term. Run it twice a year and you are past a thousand.
120
students
5
courses each
600
evaluations
Each student rates each teacher separately, so the responses multiply.
That volume is a good thing: it gives you enough data to see real differences between teachers. But it also means the survey has to be well organized, or you end up with 20 different forms nobody can compare.
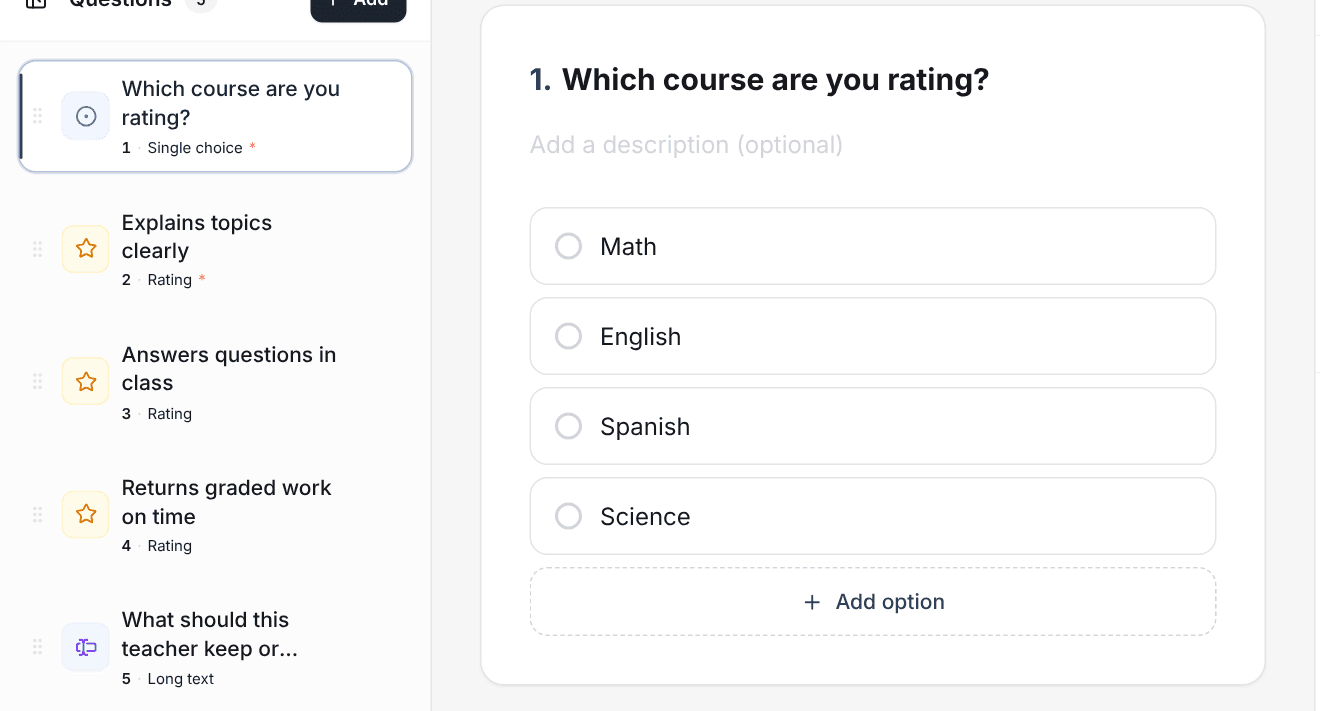
One survey, with the course as the first question
Instead of creating one survey per teacher, create a single one and start by asking which course is being rated. Students answer once per course, with the same link. All responses stay together and comparable, and if you change a question tomorrow, you change it in one place.
Ask about behaviors, not likability
"How good is this teacher?" mostly measures whether the teacher is liked. Useful questions describe something the student can observe:
- Explains topics clearly.
- Answers questions in class.
- Returns graded work on time.
- Assignments match what is covered in class.
- One open question: what should this teacher keep or change?
Four or five rating questions and one open question are enough. Remember that students will answer the same survey several times in a row: if it is long, the last evaluations get rushed.
Anonymity has to be real
A student will not criticize the person who grades them if they think they can be identified. Do not ask for a name or email, do not use personal links, and say so at the start of the survey. If a group is very small (say, a course with 4 students), open comments can give someone away: in those cases, share only the averages with the teacher.
Comparing teachers fairly
With every response in one survey, comparing by course is straightforward. Check two things before drawing conclusions: how many people answered in each group, and whether the difference is larger than chance could explain.
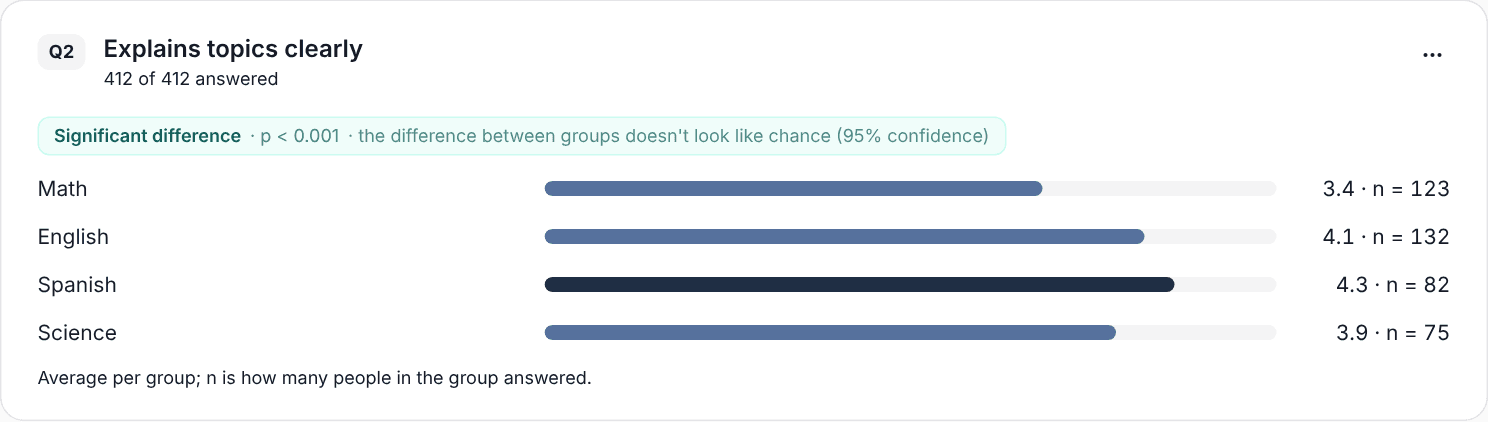
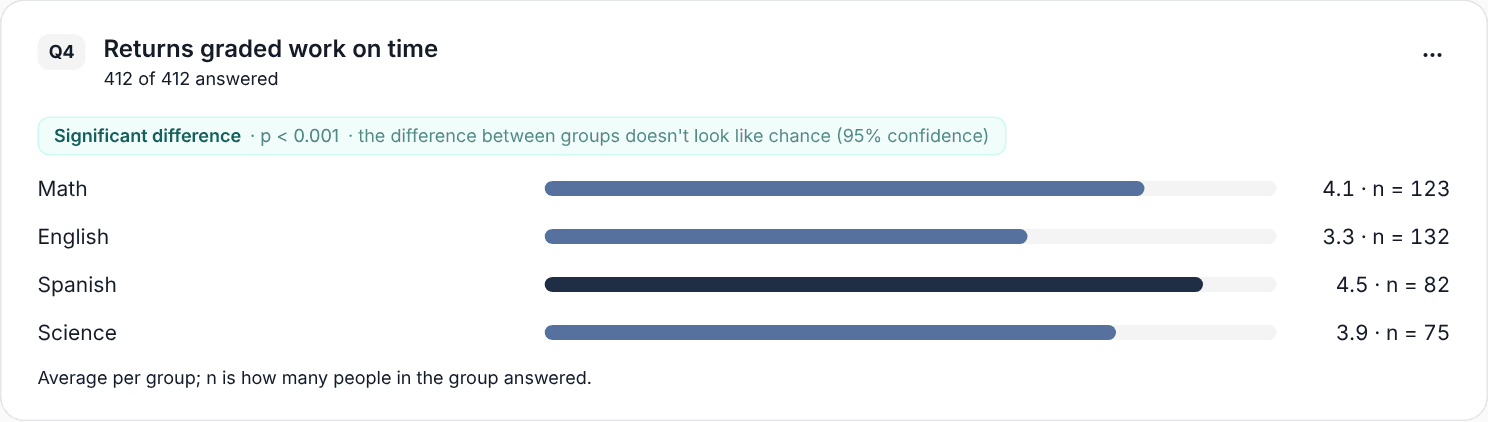
When the gap between groups is large and there are enough responses, SurvIQ flags it as a significant difference. When it is not, treat it as a hint and look again next term.
It also helps to look at each question on its own. A teacher can explain very well and still be slow to return grades. That is a far more useful conversation than "your overall average dropped".
What to do with the results
- Share each teacher's own results and comments with them, not a ranking against their colleagues.
- Ask each teacher to pick one thing to improve next term.
- Repeat the same survey every term, with the same questions, so you can see the trend.
- Tell students what changed thanks to their answers. Nothing raises participation more the next time.