How to present survey results in PowerPoint
 By Enzo CaminoPsychologist and founder of SurvIQ
Most results presentations fail for the same reason: one slide per question, with the chart and the question text as the title, in questionnaire order. Whoever watches it has to draw their own conclusions from 30 charts in a row.
The order that works
- Methodology: who responded, how many, when and with what margin of error.
- Executive summary: three to five findings on one slide, before any chart.
- Overall result: one chart with every key question side by side, sorted from highest to lowest.
- Detail by theme: questions grouped by dimension, not in questionnaire order.
- Differences by group: only the real ones, by department, location or profile.
- Comments: main themes with their percentage and two or three quotes.
- Appendix: the rest of the charts, for anyone who wants to check them.
Which chart for each question
- Single choice with few options: sorted horizontal bars. Avoid pies with more than three options.
- Agreement or satisfaction scales: 100% stacked bars or the average, always with the same scale across the deck.
- Multiple choice: horizontal bars with the % of people who picked each option (the total goes over 100%).
- NPS: the number, with the split of promoters, passives and detractors.
- Comparison by group: one bar per group and the Total alongside, in a single color.
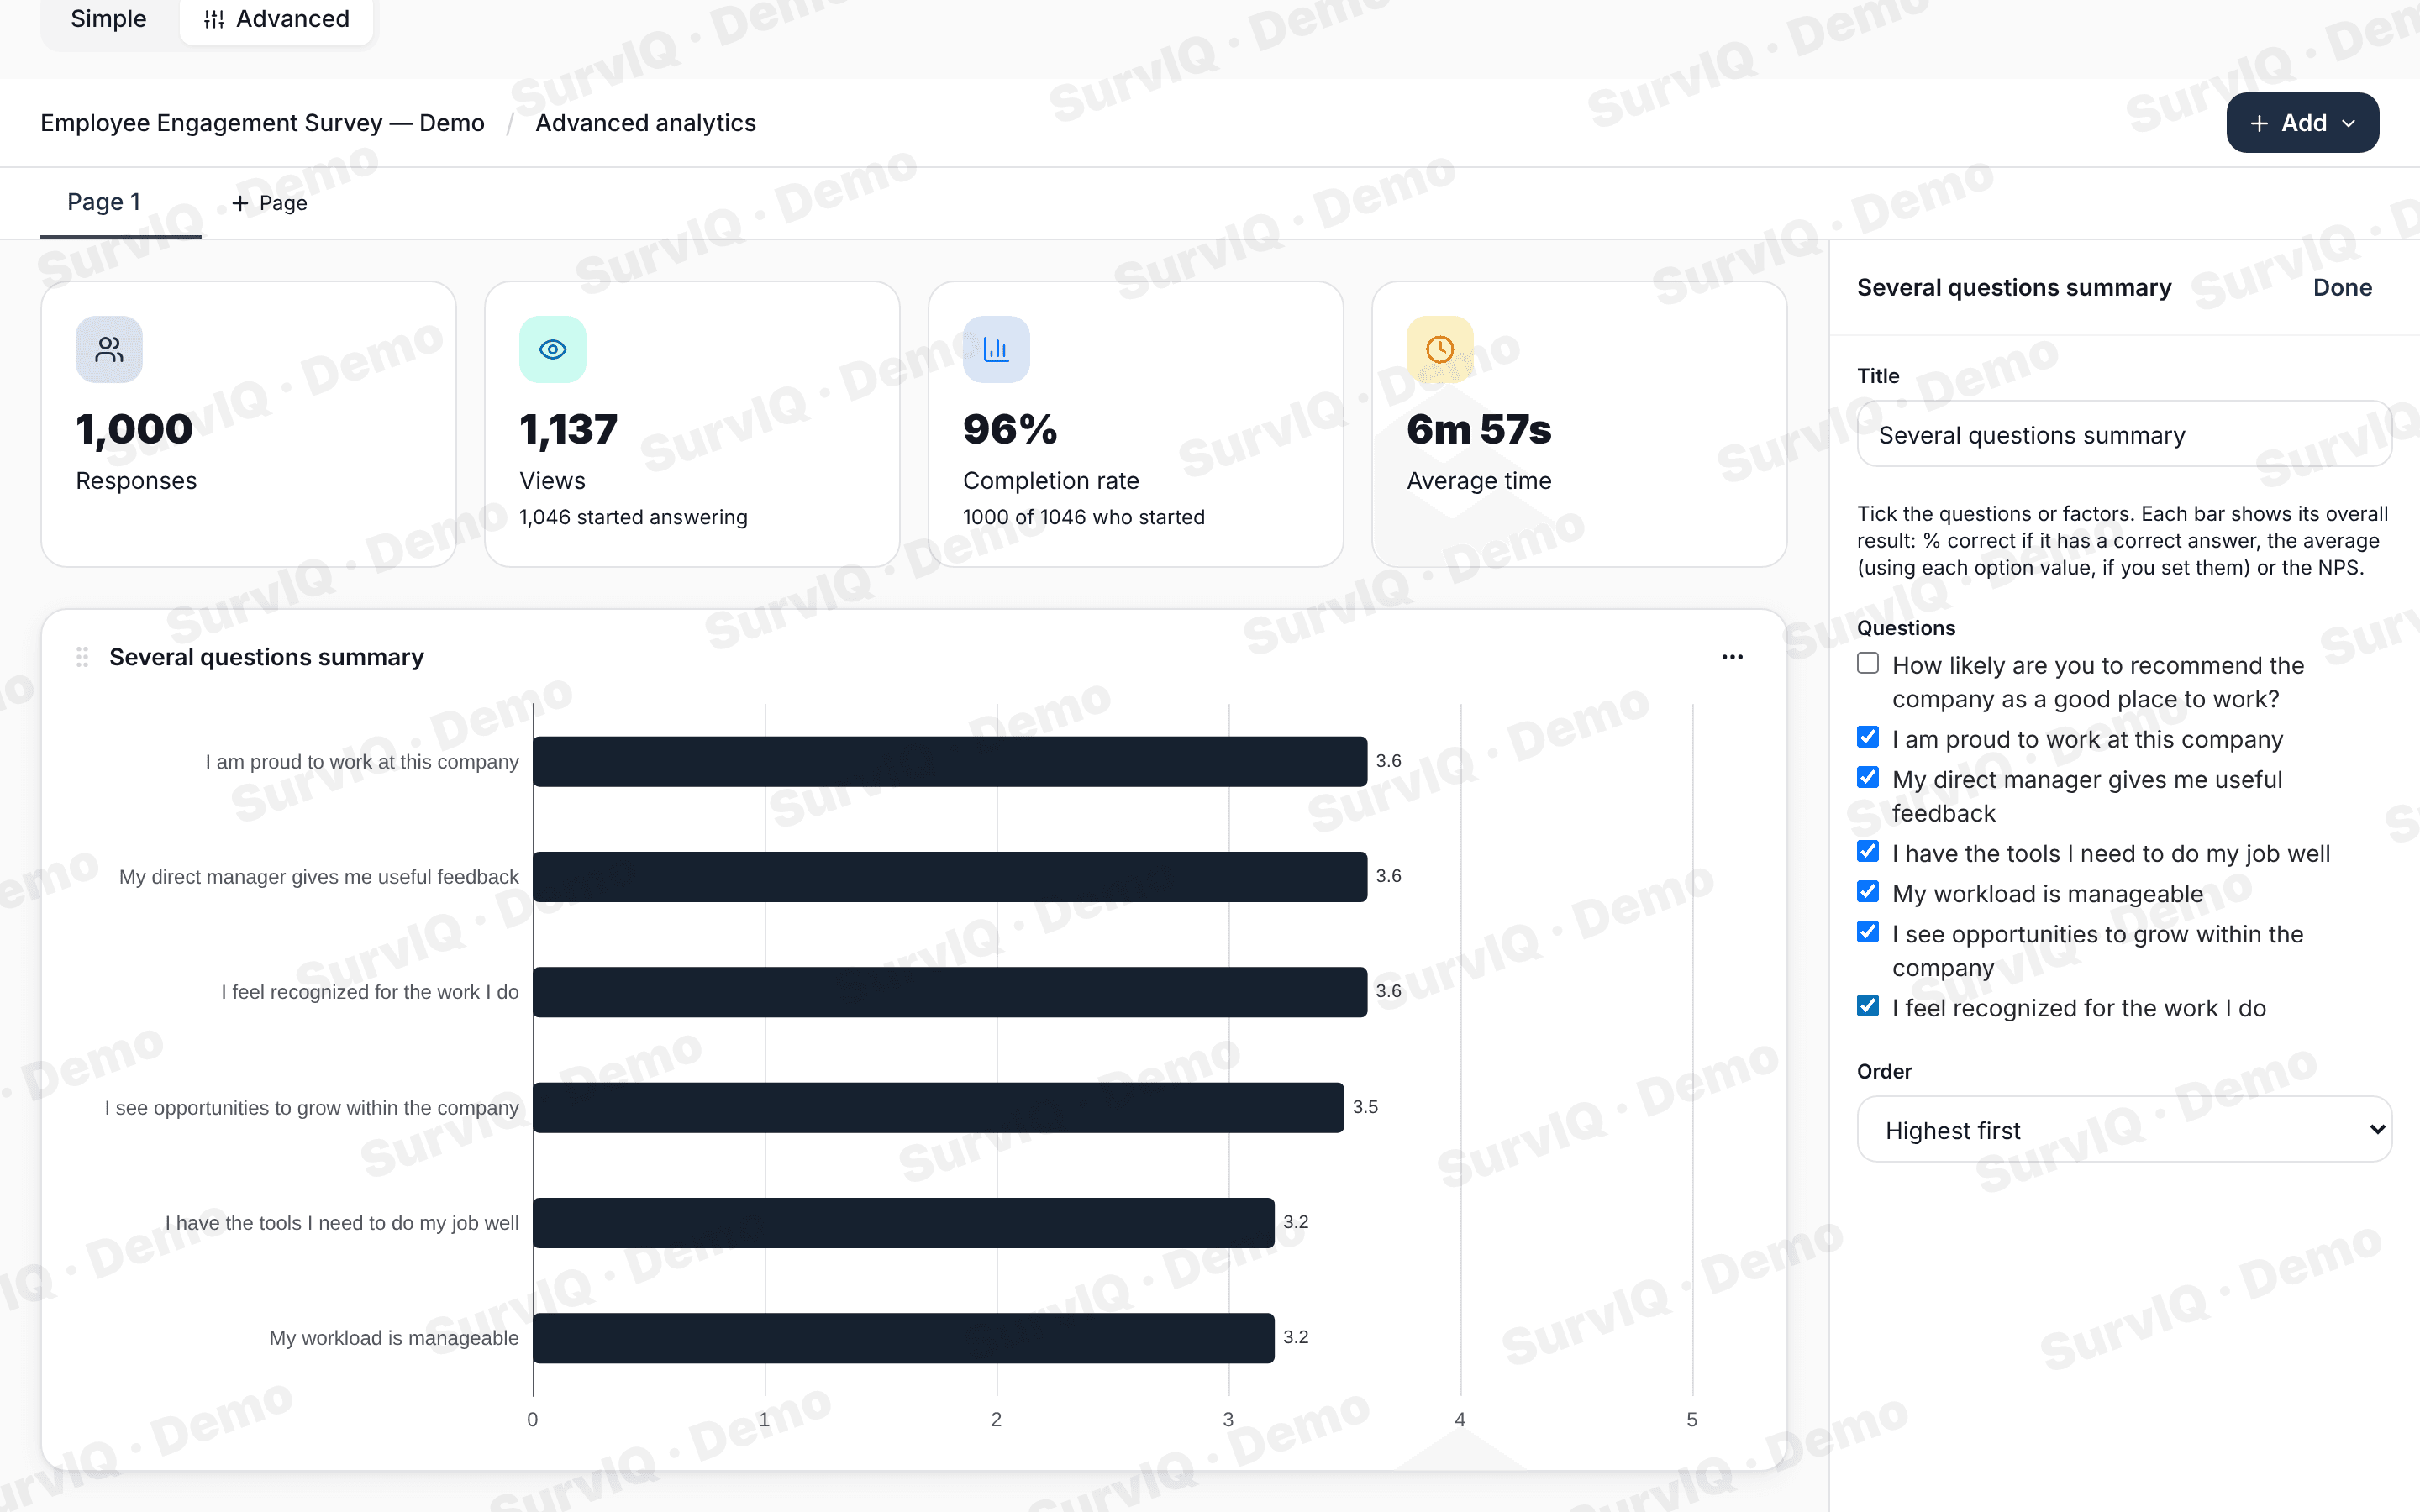
The title states the finding
A slide's title isn't the question, it is what people need to understand. Instead of "Satisfaction with work tools", write "Operations rates its tools lowest". The chart proves the title.
If you can't write a title with a finding, the slide probably belongs in the appendix.
Get the PowerPoint without building it by hand
Copying charts from Excel into PowerPoint one by one is what takes the most time. In SurvIQ you build the dashboard in advanced results (or generate it all at once with Charts by segment) and export it:
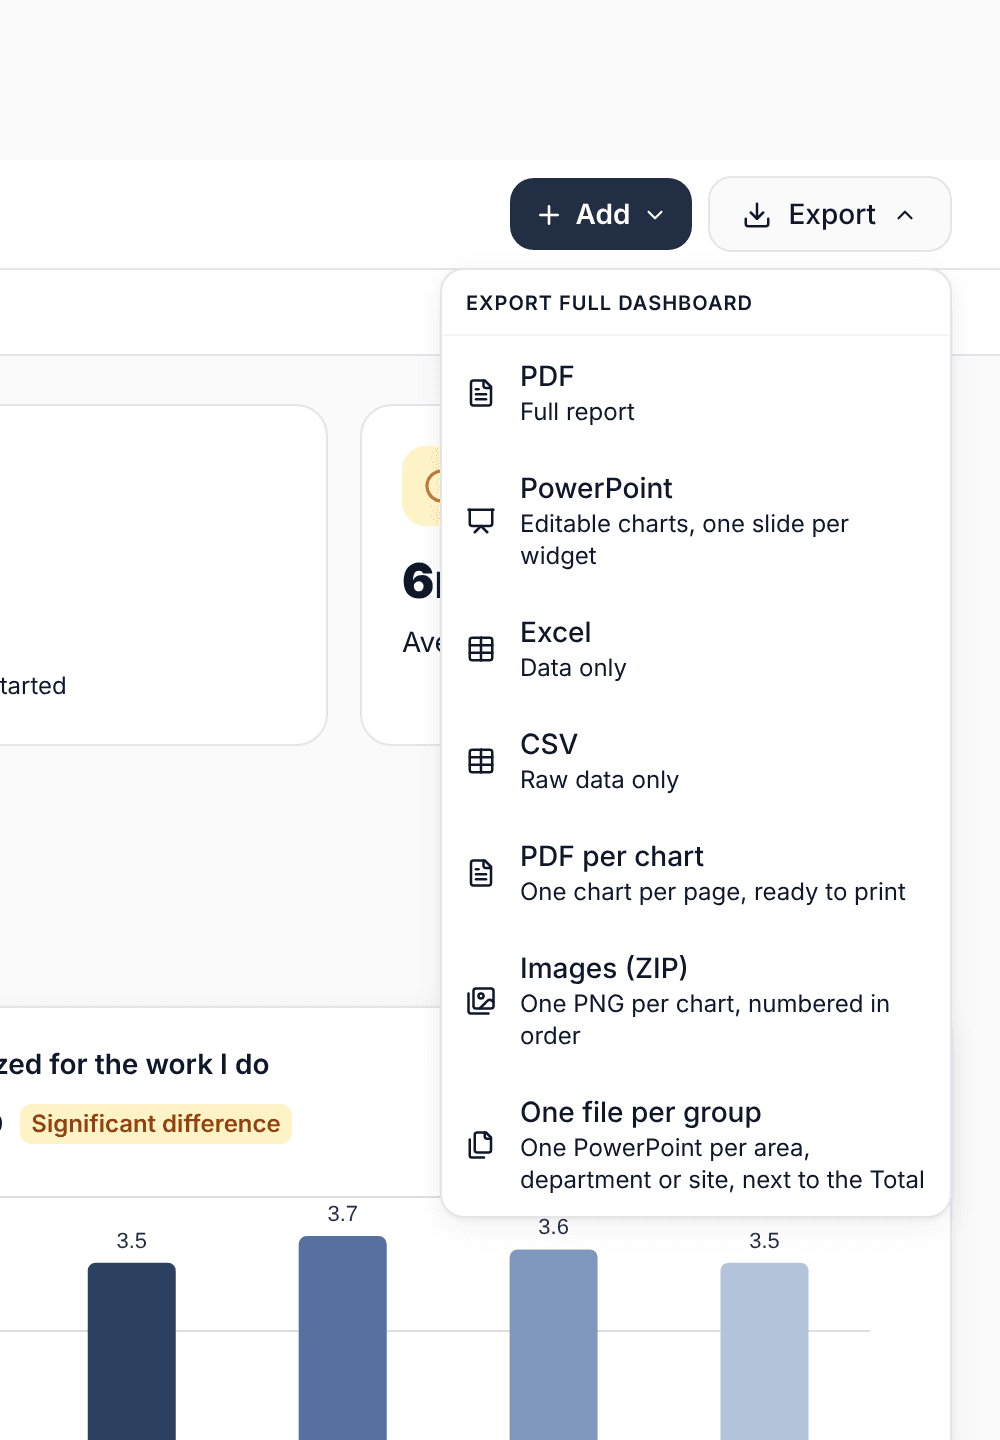
- PowerPoint with editable charts, one slide per chart: change colors and text in PowerPoint.
- One file per group: a PowerPoint for each department or division, with its results against the Total.
- PDF per chart or PNG images, if you are building the deck with your own template.
What no export does is write the titles with the finding. That part is still yours, and it is what makes the presentation useful.
To get every chart by department at once:
Charts by segment