For consultants
From the response file to the report by department, without pivot tables
For consultants and HR teams who analyze engagement, internal communication or satisfaction surveys. Bring responses from any platform and get every slide at once.
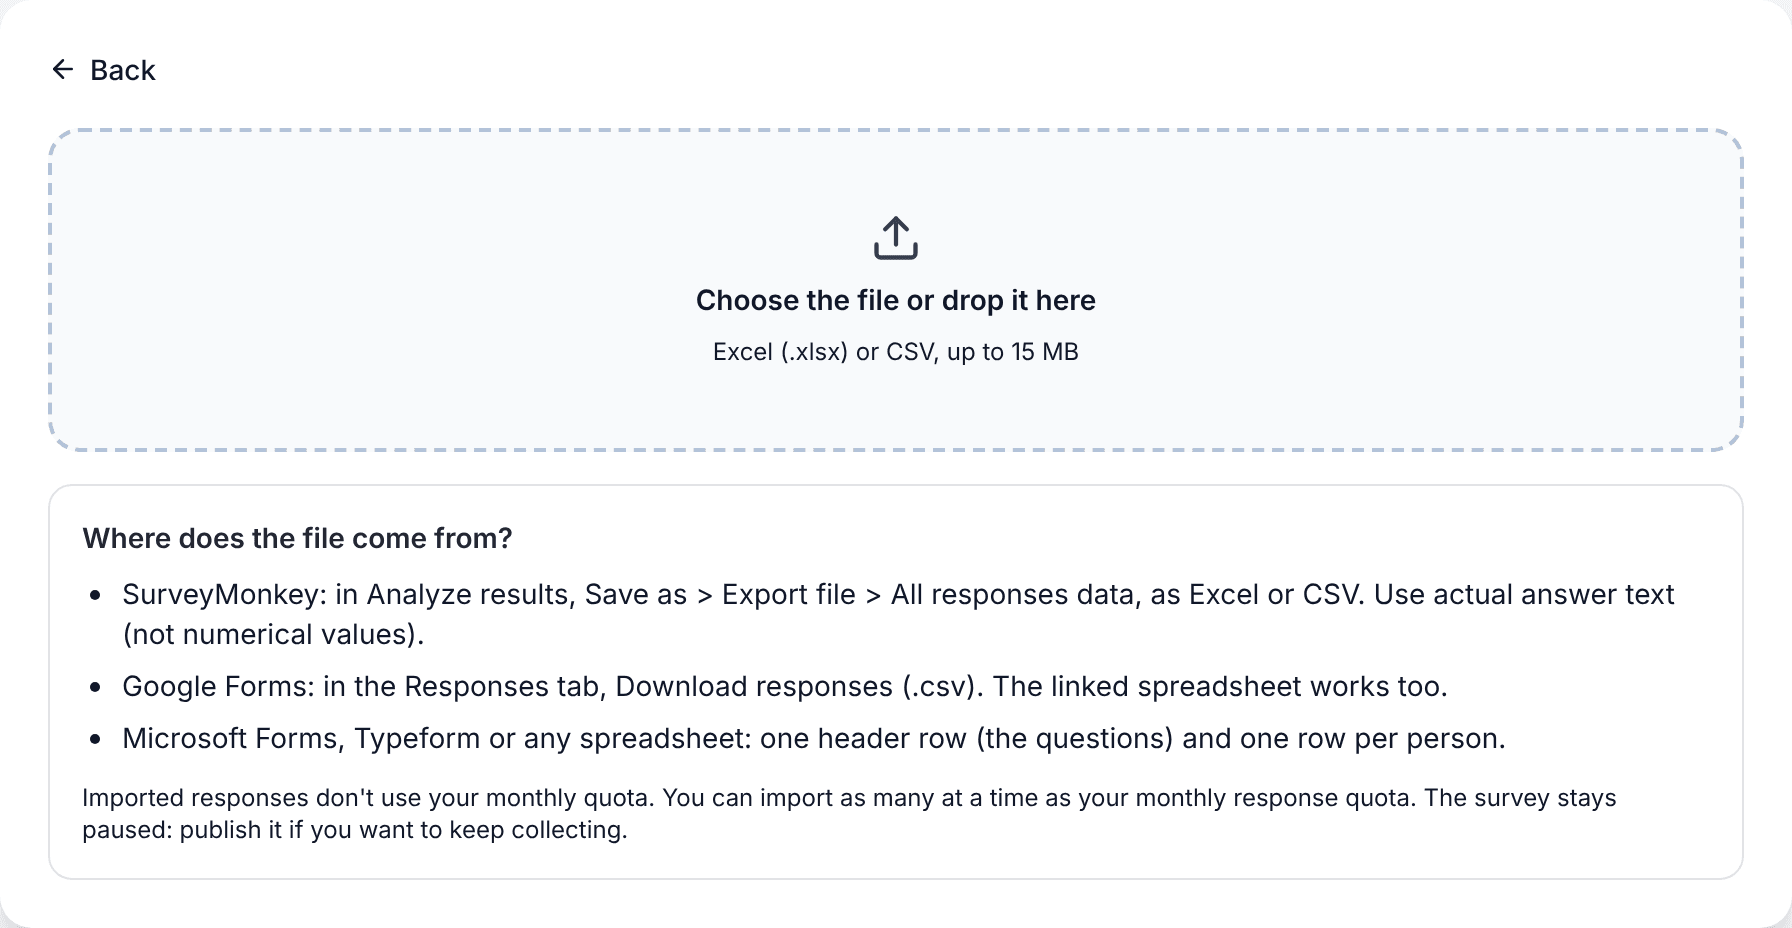
1. Bring responses from wherever they are
Upload the Excel or CSV export from SurveyMonkey, Google Forms, Microsoft Forms or any spreadsheet. SurvIQ recognizes the questions, orders the scales and loads every response. You can also run the survey directly in SurvIQ.
- Recognizes SurveyMonkey’s two header rows, multiple-choice questions and matrices.
- Agreement or satisfaction scales are ordered from low to high and worth 1, 2, 3…
- Imported responses don’t use your plan’s monthly quota.
2. Participation by department, with margin of error
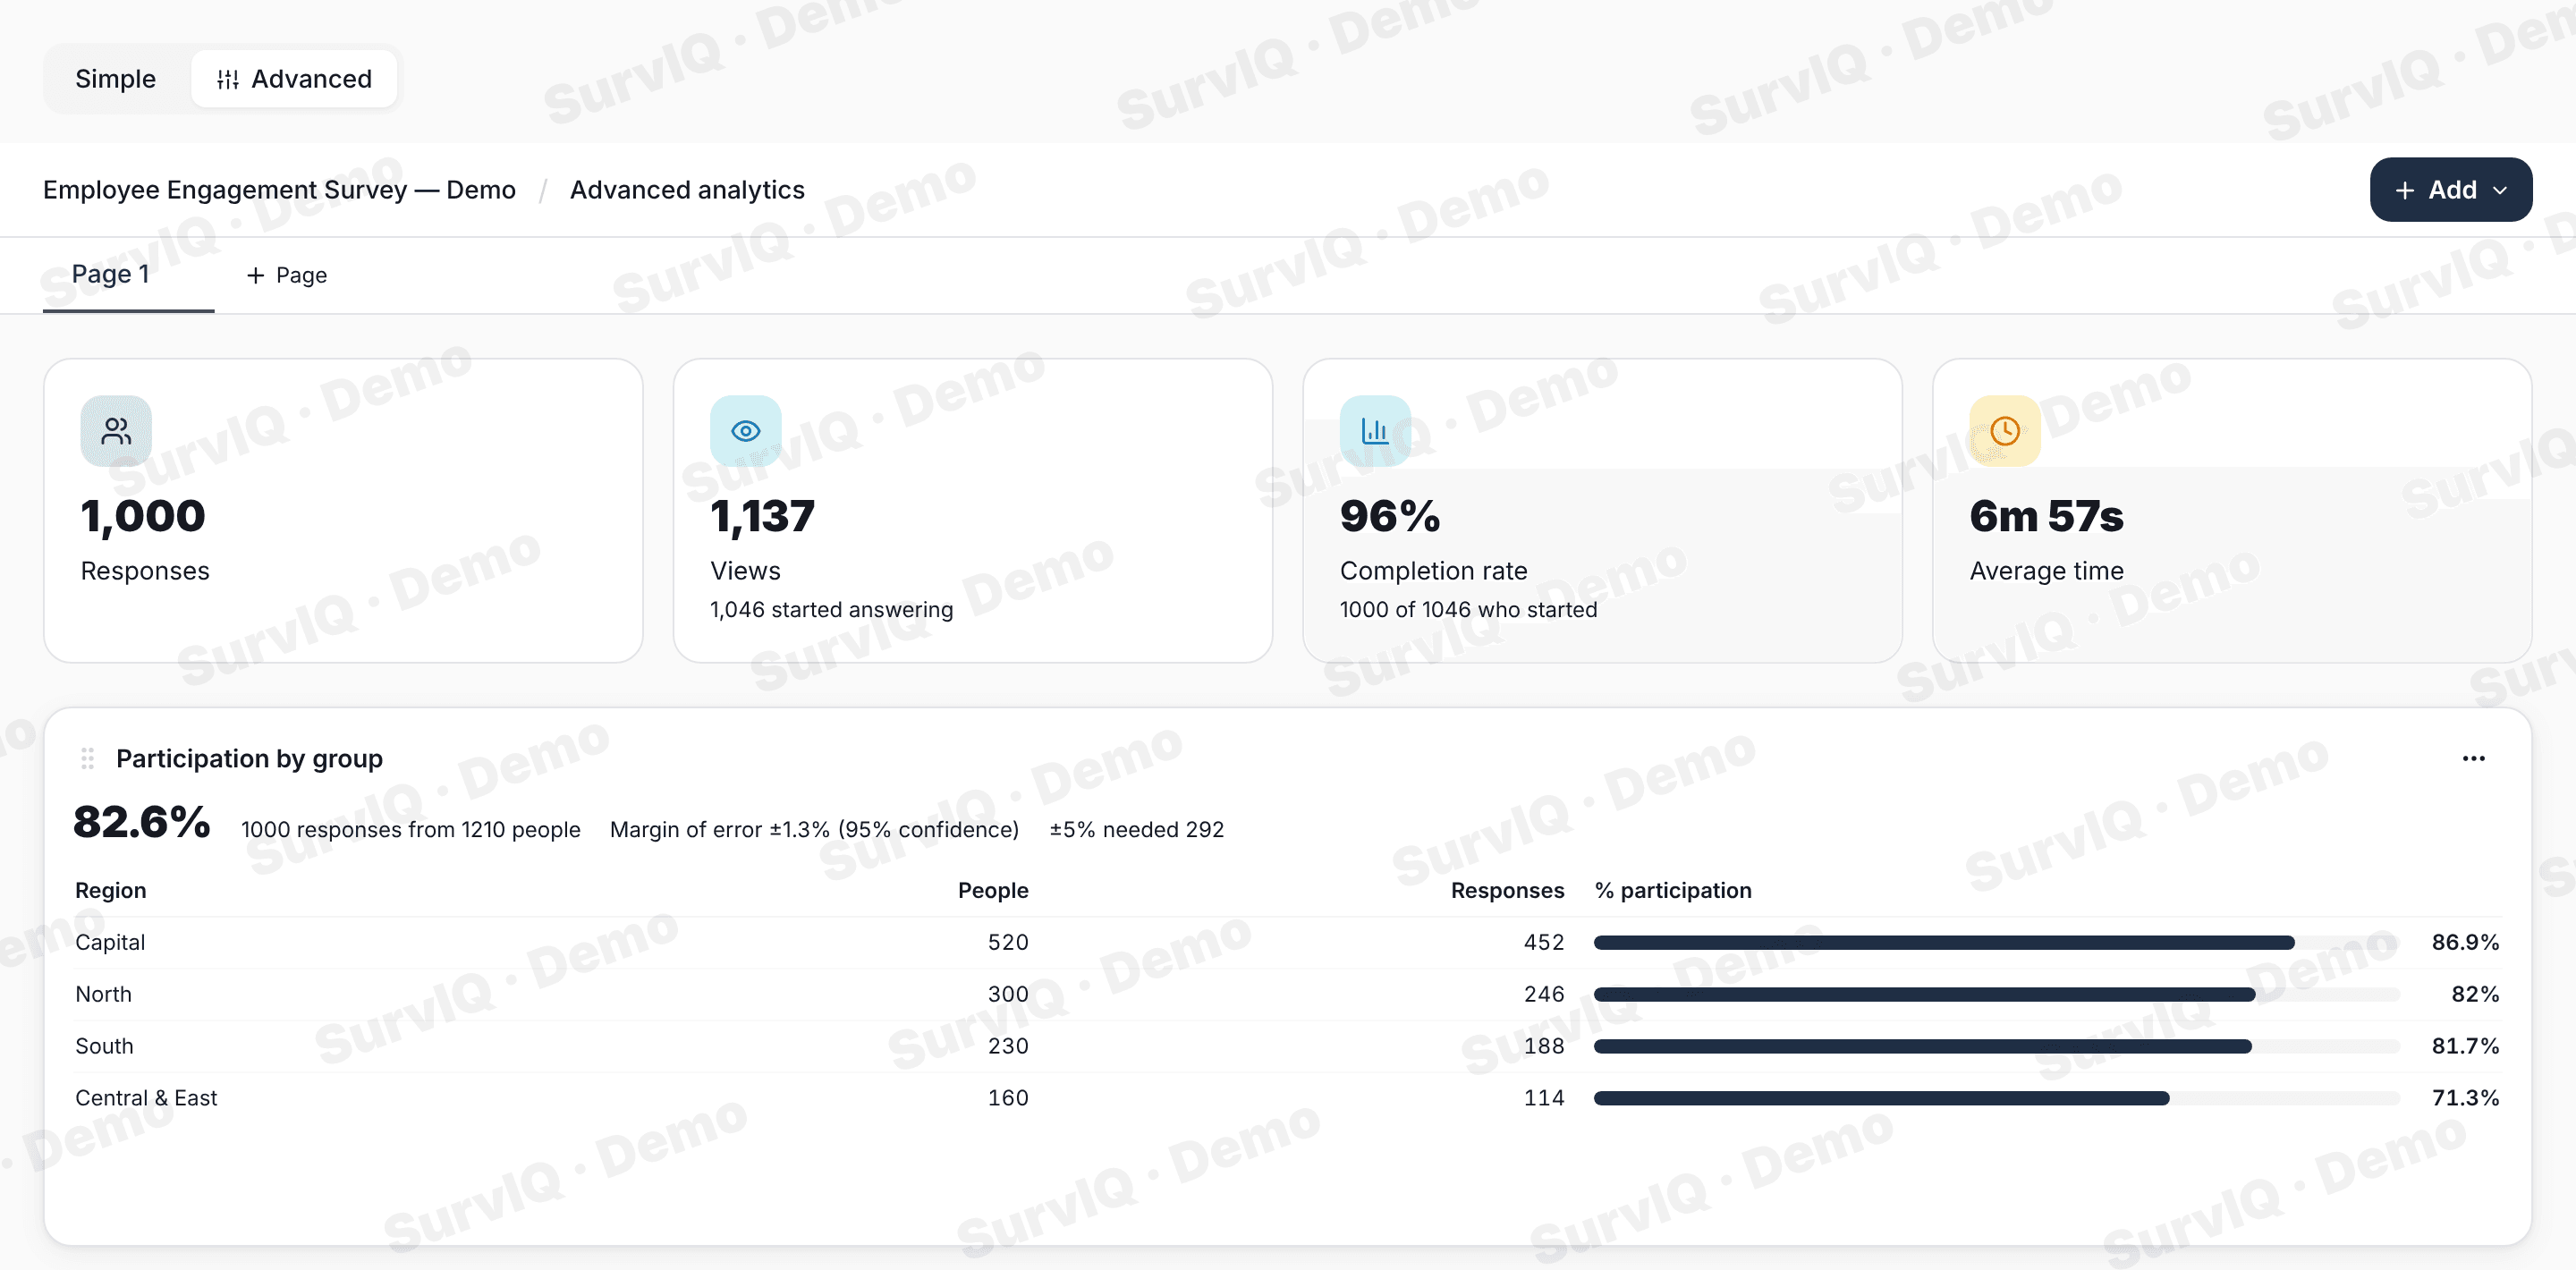
Paste each department’s headcount from Excel and get the participation table: each department’s rate, the total and the margin of error adjusted for the population, which with good participation is much smaller than people expect.
- SurvIQ suggests the department, office or location question on its own.
- It tells you how many responses you needed for a ±5% margin.
3. Every slide by department in one step
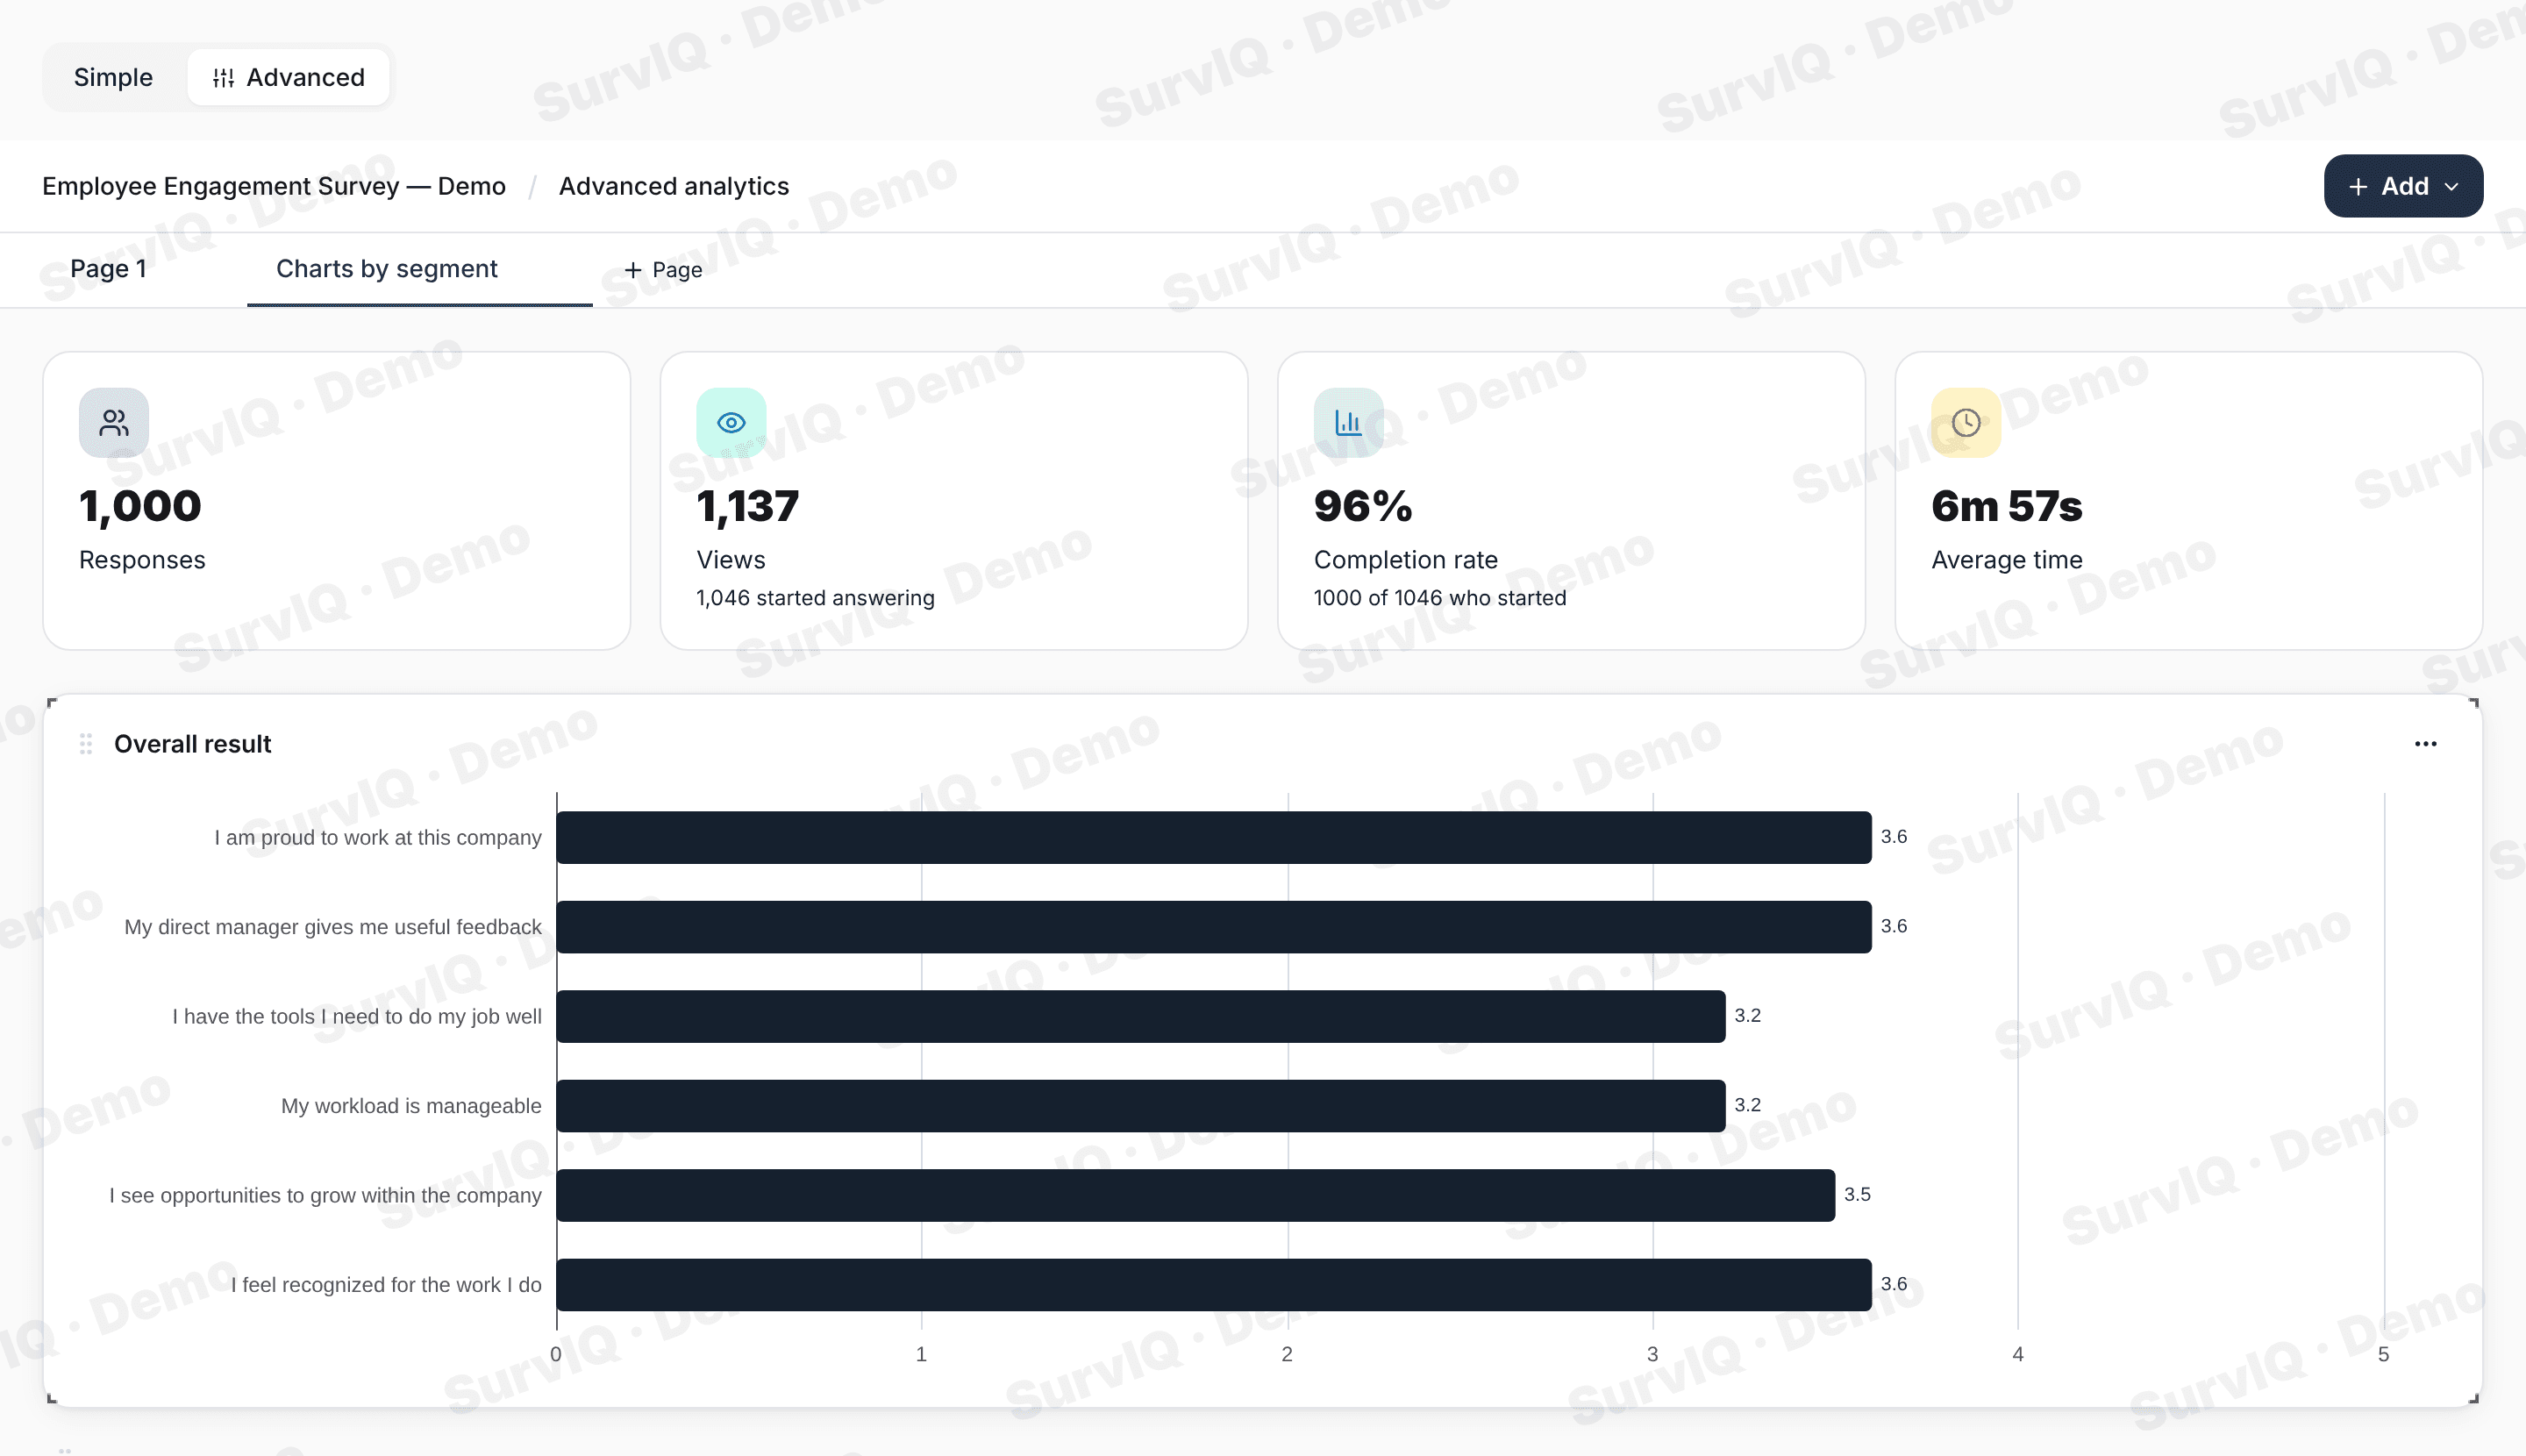
Charts by segment builds each question by division, department or region at once, with an overall summary on top. Groups under 5 people are combined into "Other" to protect anonymity.
- With many departments, choice questions come out as 100% stacked bars or a table, so they stay readable.
- You can generate only the questions where the difference between departments is real.
- Knowledge questions show as Correct / Incorrect by department.
4. Factors, knowledge and groups your way
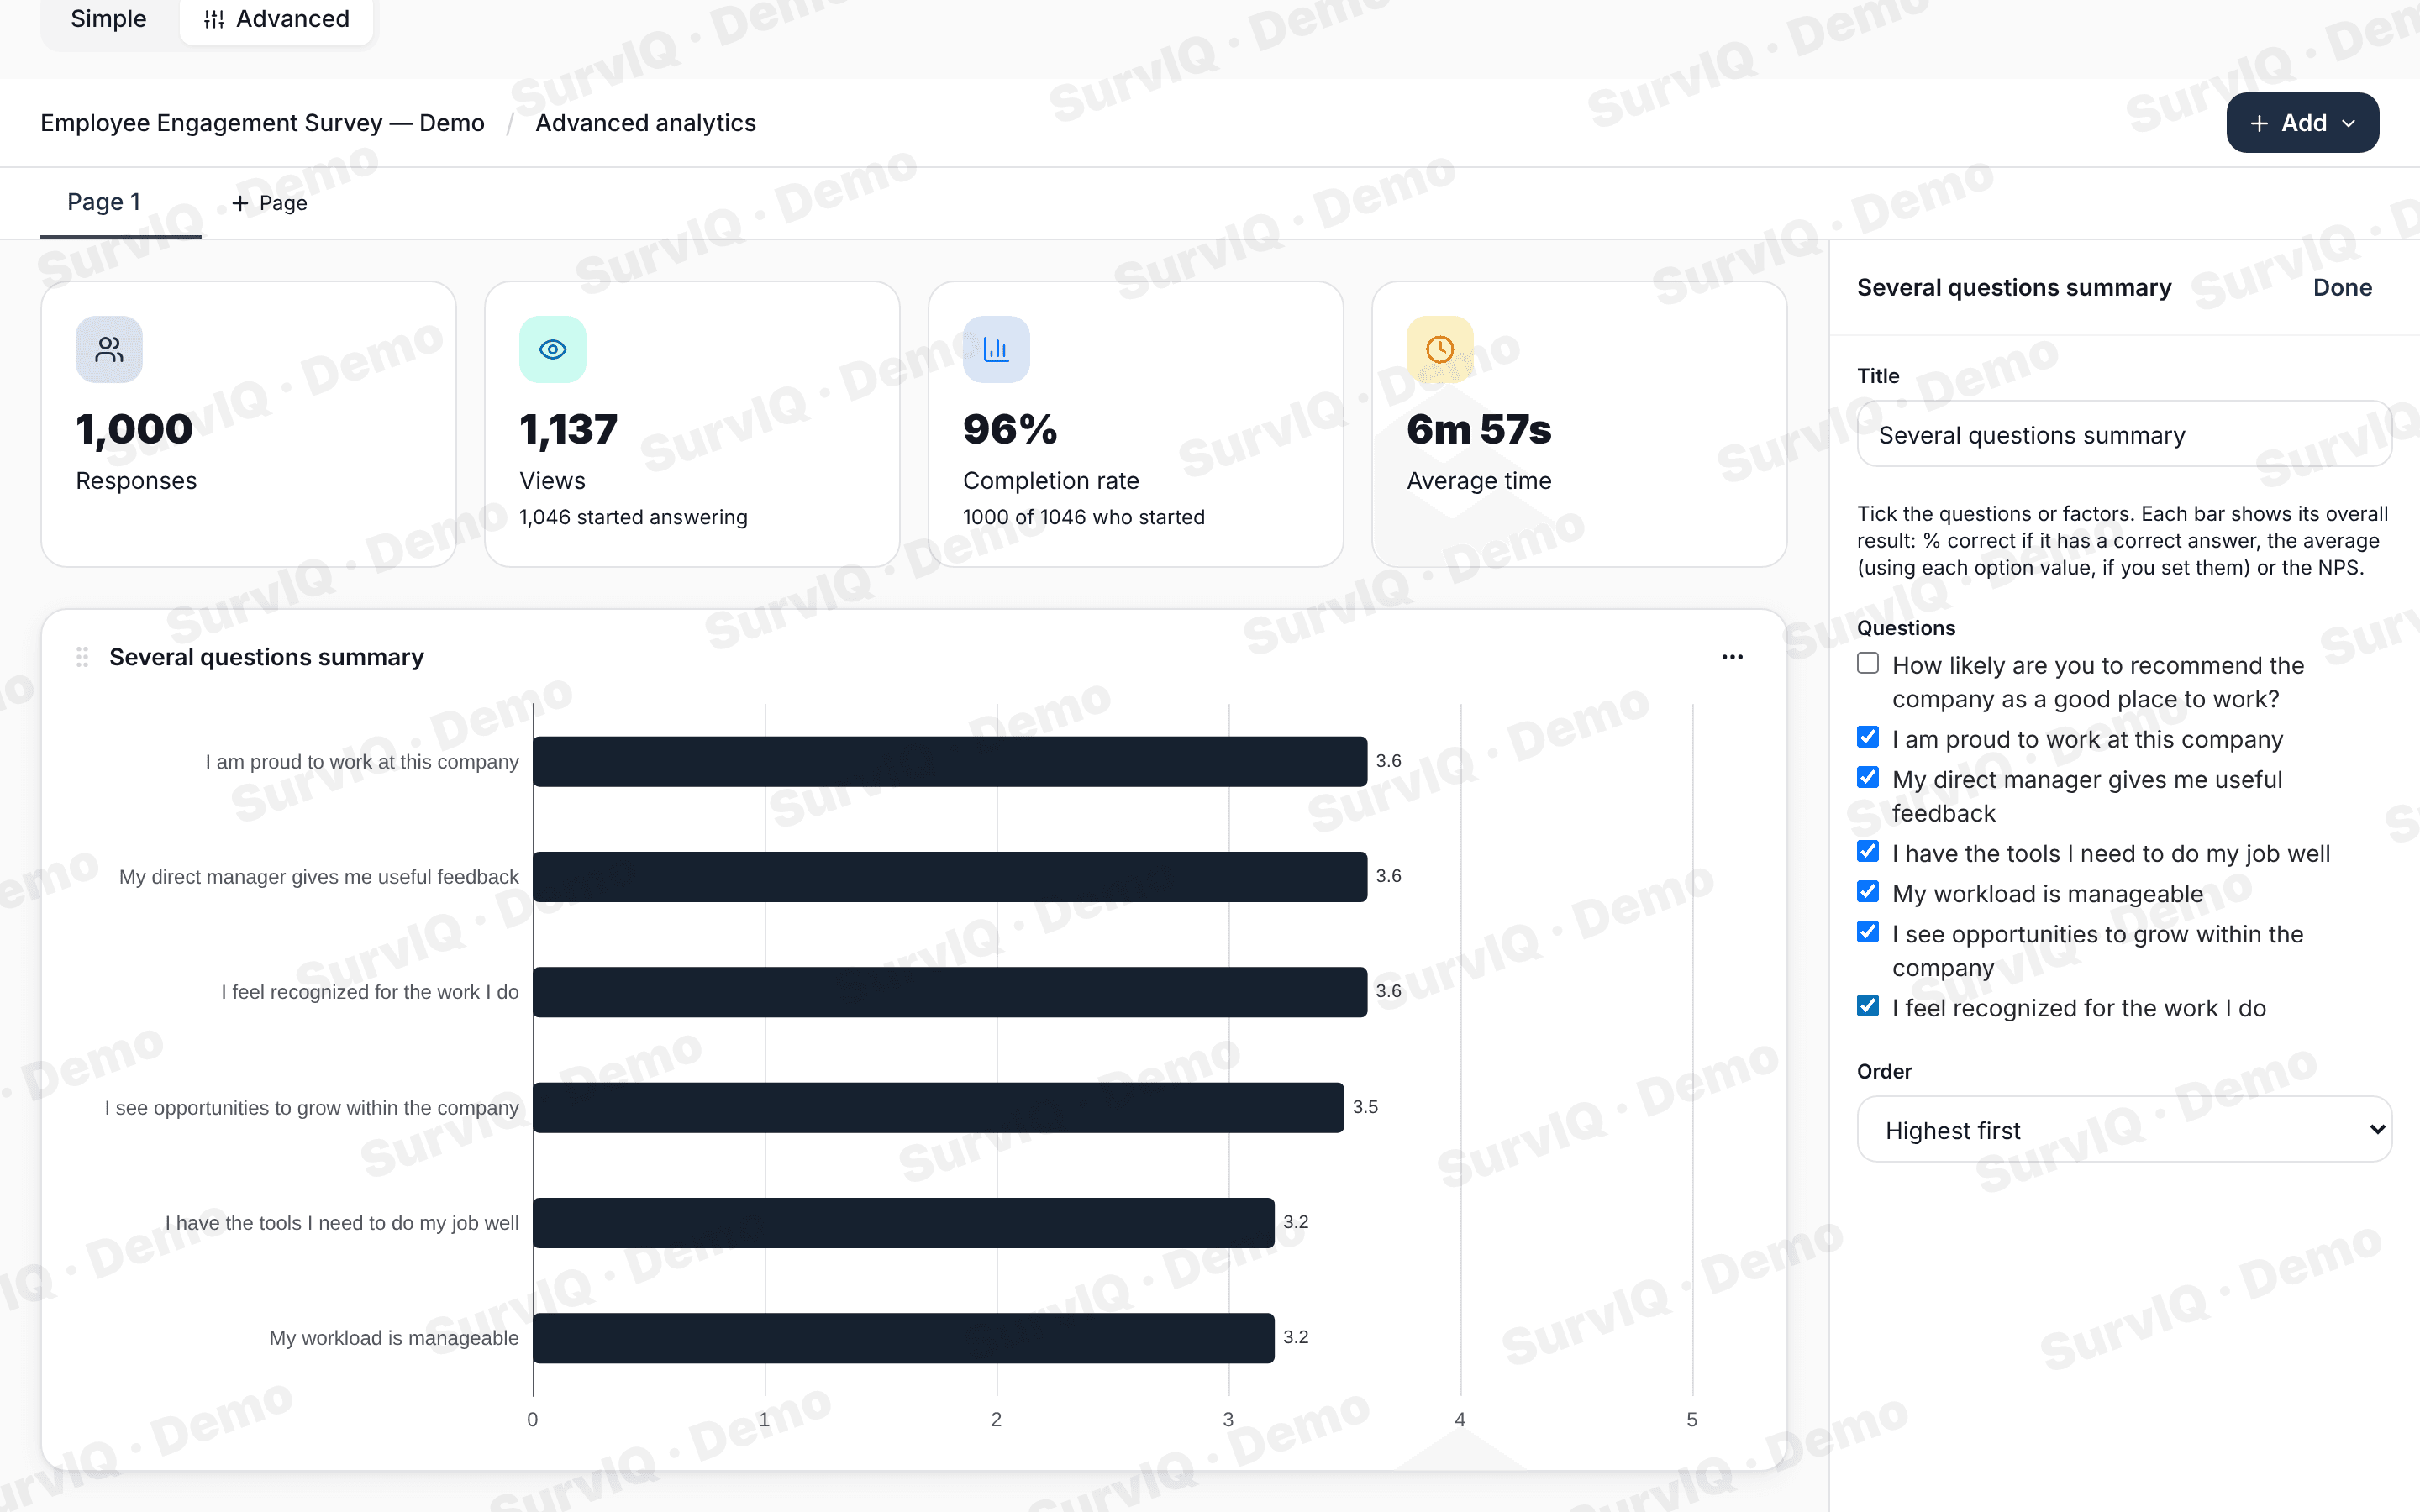
Group questions into factors (Leadership, Communication, Conditions) and get the factor table by department. Mark the correct answer on knowledge questions and see the % correct. Combine small offices or rename groups without touching the responses.
- The Several questions summary puts averages, % correct or NPS side by side.
- The groups you build work in filters, charts, Excel and SPSS.
5. Export and write the finding
The whole page exports to PowerPoint with editable charts or to PDF, plus one file per department. The analysis is yours: SurvIQ saves you building the slides so your time goes into reading them.
- Analysis Excel with a sheet per question, cross-tabs and the data.
- Share results with your client by link or give them access to their department.
Which surveys
Employee engagement
Favorability by factor and department, participation and comments grouped by theme.
Internal communication
Knowledge of key messages, preferred channels and perception, by division.
Customer satisfaction
NPS and satisfaction by location, channel or customer type, with the total alongside.
Diagnostics on someone else’s data
When the client already ran the survey and just sends you the Excel file.
What each plan includes
Import responses from SurveyMonkey, Google Forms or Excel
All plans, up to your monthly quota per import
Filters, grouped options and computed variables
From Basic
Charts by segment, overall summary and factor table
From Pro
Participation by department with margin of error
From Pro
Export the dashboard to PowerPoint and PDF
From Pro
Imported responses don’t count toward the monthly response limit.
Step-by-step guides
Frequently asked questions
- Do I have to run the survey again?
- No. Import the Excel or CSV file with the responses you already have and SurvIQ builds the survey from the file.
- What happens to my clients’ data?
- It is yours. SurvIQ never sells anyone’s data and you can delete or download it anytime.
- Can I work with my team?
- Yes. With an organization, your team works on the same surveys and everything bills to the owner account.
- Does AI write the findings?
- SurvIQ has AI to summarize results and classify comments, but you write the finding for each slide. That is where your value as a consultant is.
- Does it work if the client uses a different scale?
- Yes. You check the order and value of each option when importing, and you can change them later in the editor.
Try it with the Excel file from your last survey
Create a free account, import the file and see how long it takes to get the slides by department.
Create a free account