How to get your survey charts by department, team and gender without building them one by one
 By Enzo CaminoPsychologist and founder of SurvIQ
When an engagement or satisfaction survey closes, the overall result is the first thing people look at and the least useful. Leadership doesn't ask "how did we do?", they ask "how did Operations do?", "is there a gap between men and women?", "what's going on at the north site?". The answer lives in the breakdowns.
The problem is volume. 20 questions times 5 breakdowns (department, team, gender, tenure and location) is 100 charts. Built by hand in Excel, with pivot tables, colors and titles, that is days of work. And when one more response comes in or someone asks to leave out interns, you build them again.
What a good breakdown chart needs
- The Total next to every group, so you see at a glance who is above and who is below.
- The chart type that fits the question: an average isn't charted the same way as a multiple-choice question.
- The size of each group (n) in view, because 80% of 5 people doesn't weigh the same as 80% of 200.
- Very small groups hidden, so nobody is exposed in a confidential survey.
- A signal for when a difference between groups is real and not noise.
How to do it in SurvIQ in three steps
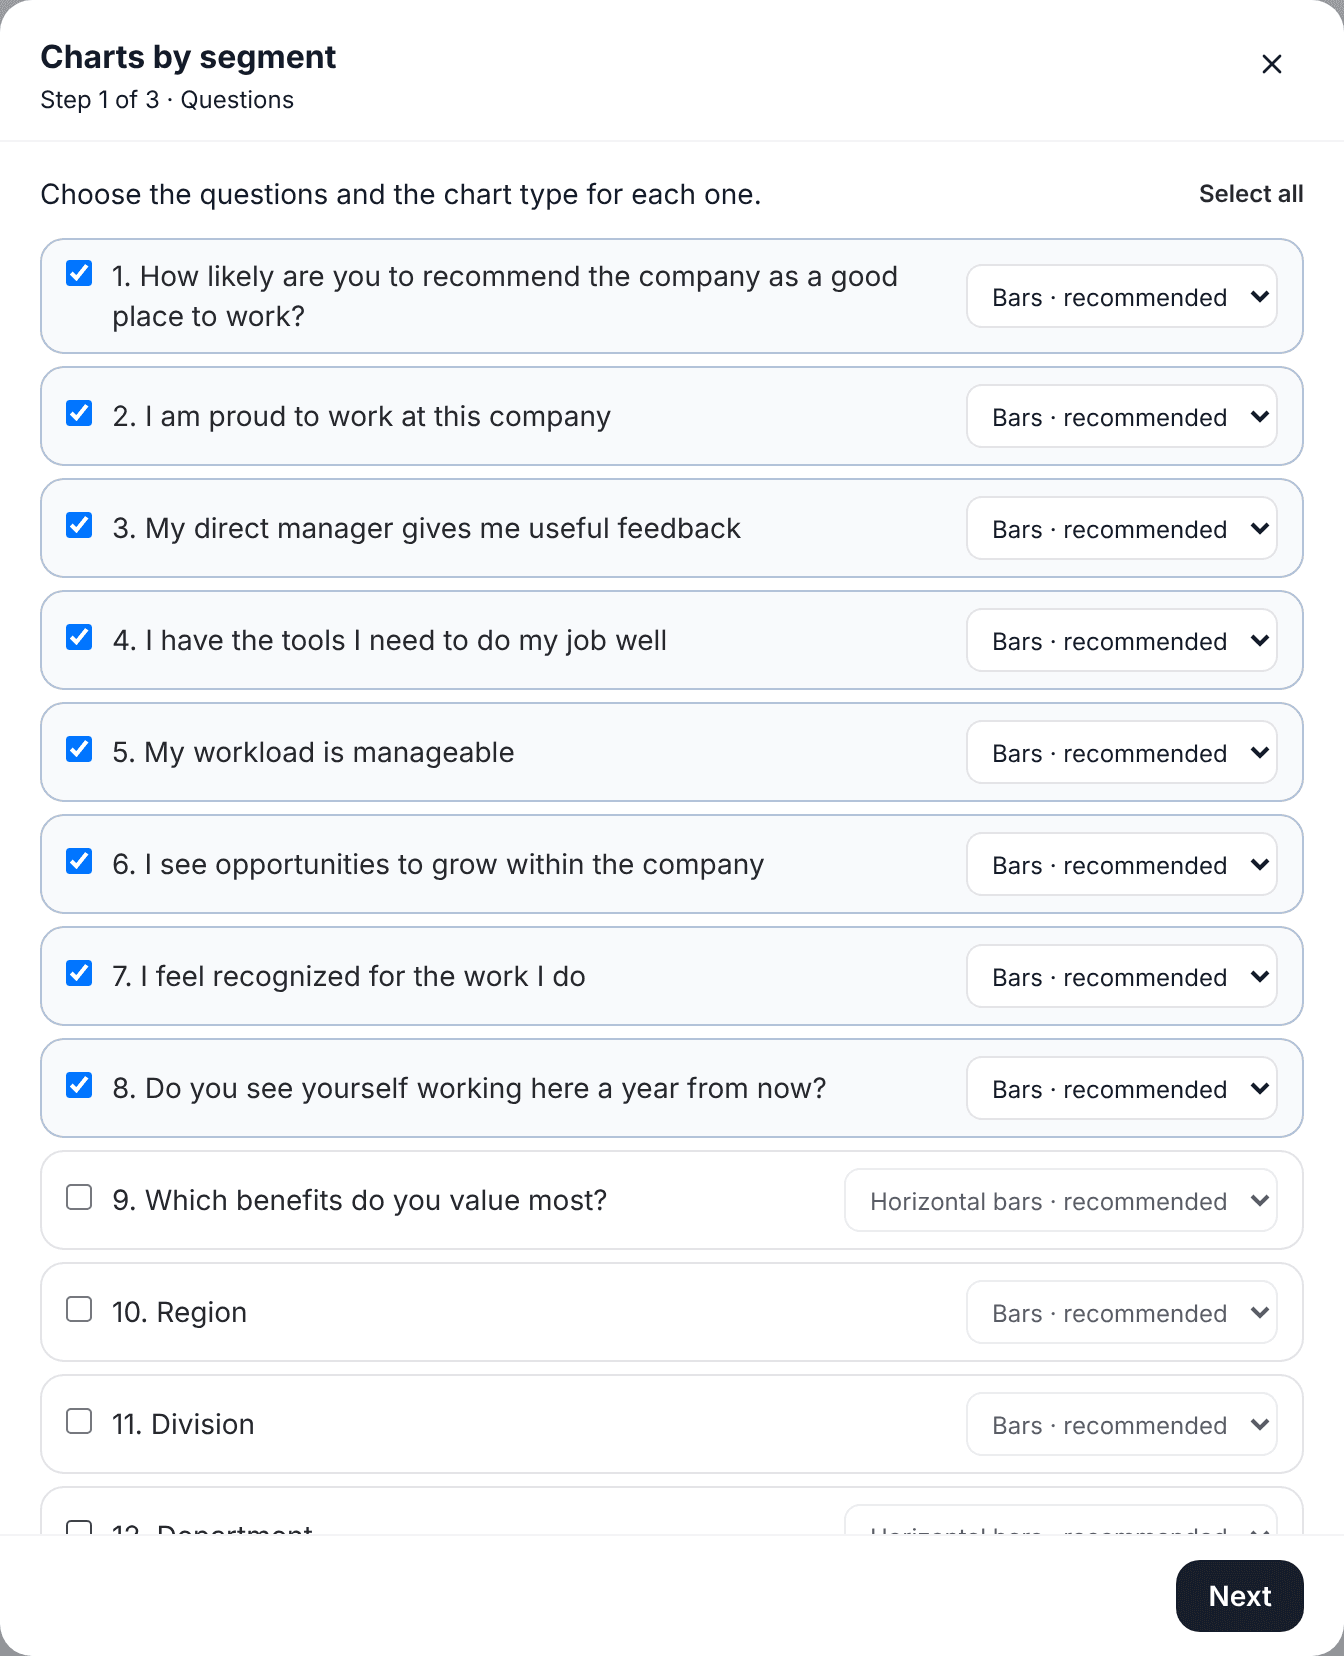
In the survey's advanced results, Add has a "Charts by segment" option. It opens a three-step wizard. First you pick the questions to chart. Each one comes with the recommended chart type for that question, and you can change it: bars, horizontal bars, 100% stacked, lines, radar or table. Only the types that make sense for that question show up.
Then you pick how to split the results. Any choice question in the survey works ("Which department do you work in?"), as does a variable with ranges (for example tenure bands) or a hidden field in the link, like area=Sales if each department got its own link. You can pick several: each one builds its own block of charts.
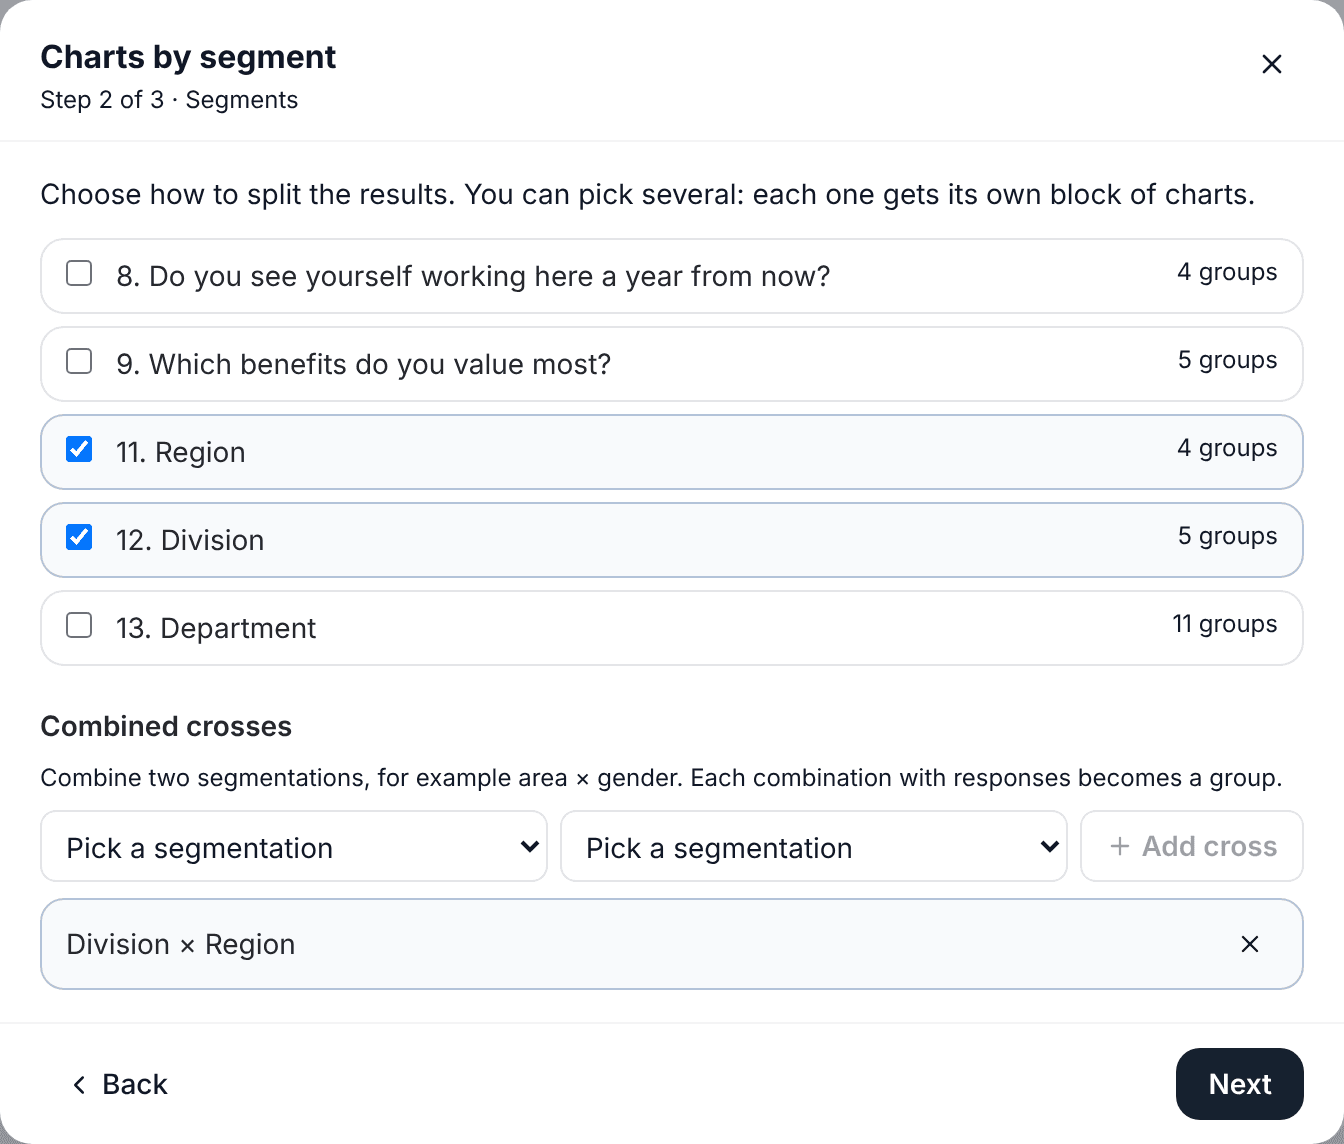
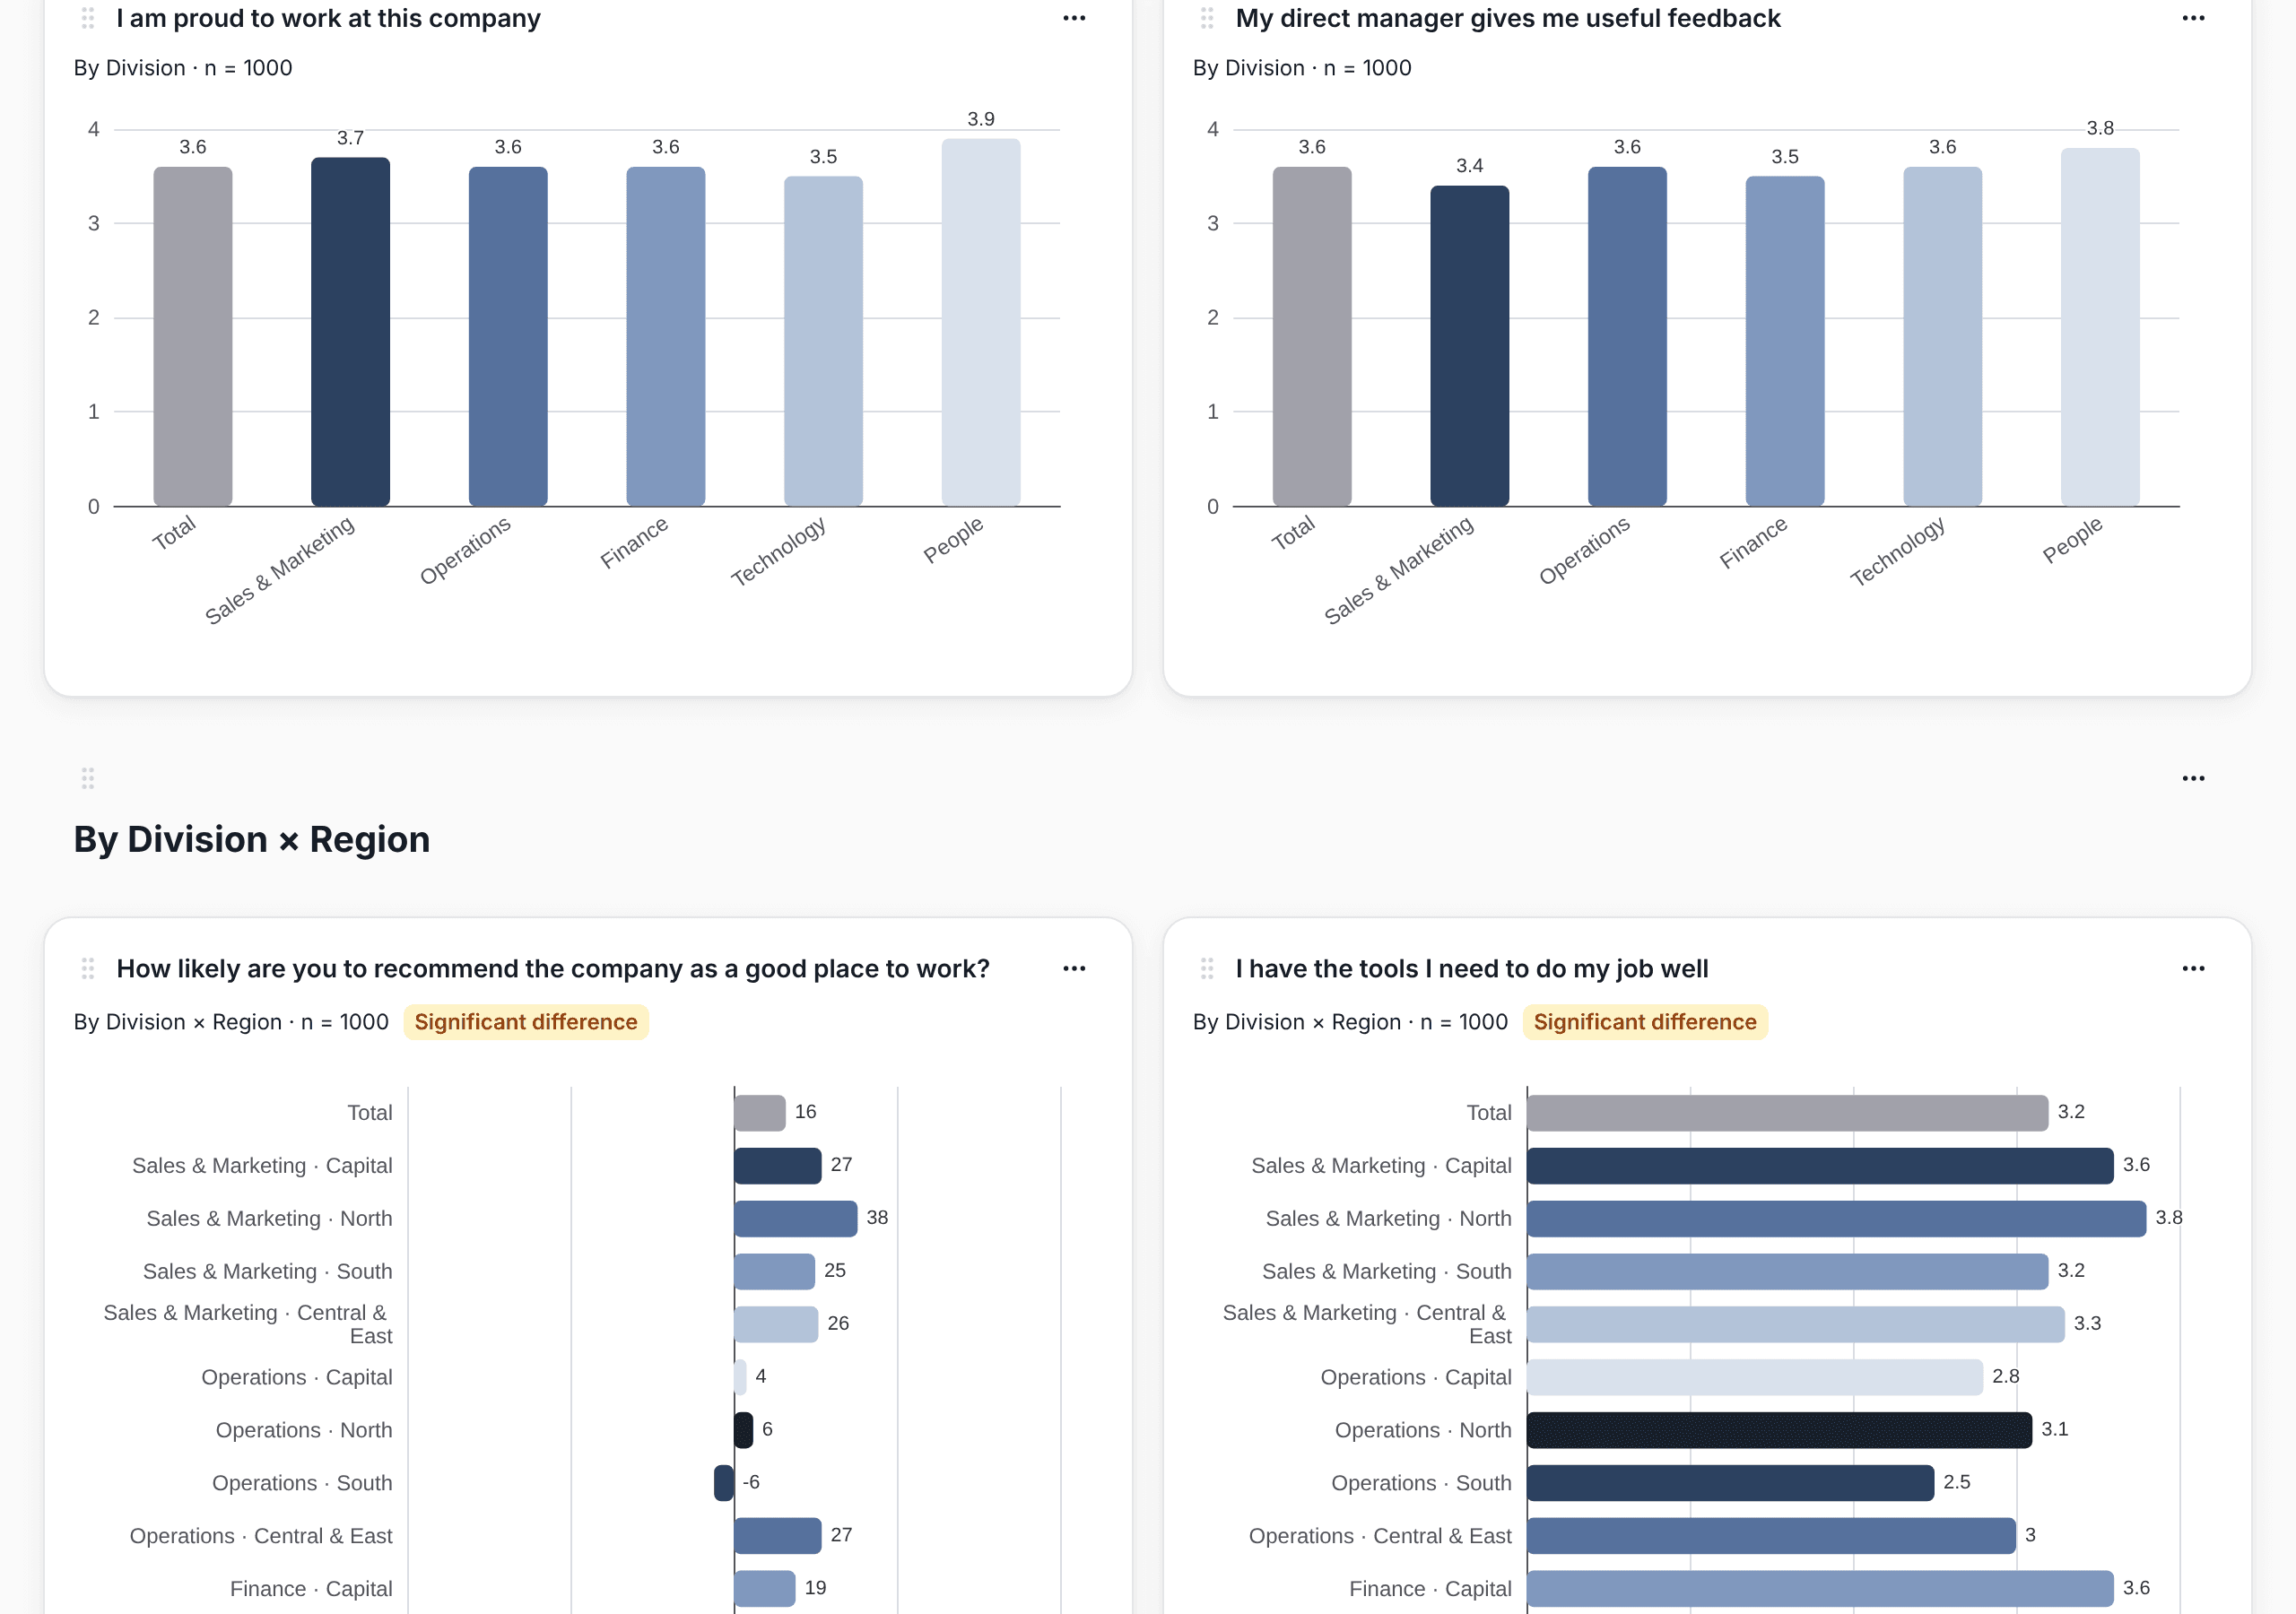
In the same step you can combine two segments into a cross, for example department × gender. Each combination with responses becomes a group: "Sales · Woman", "Sales · Man", "Legal · Woman". It's how you see whether a gender gap shows up across the company or only in one department.
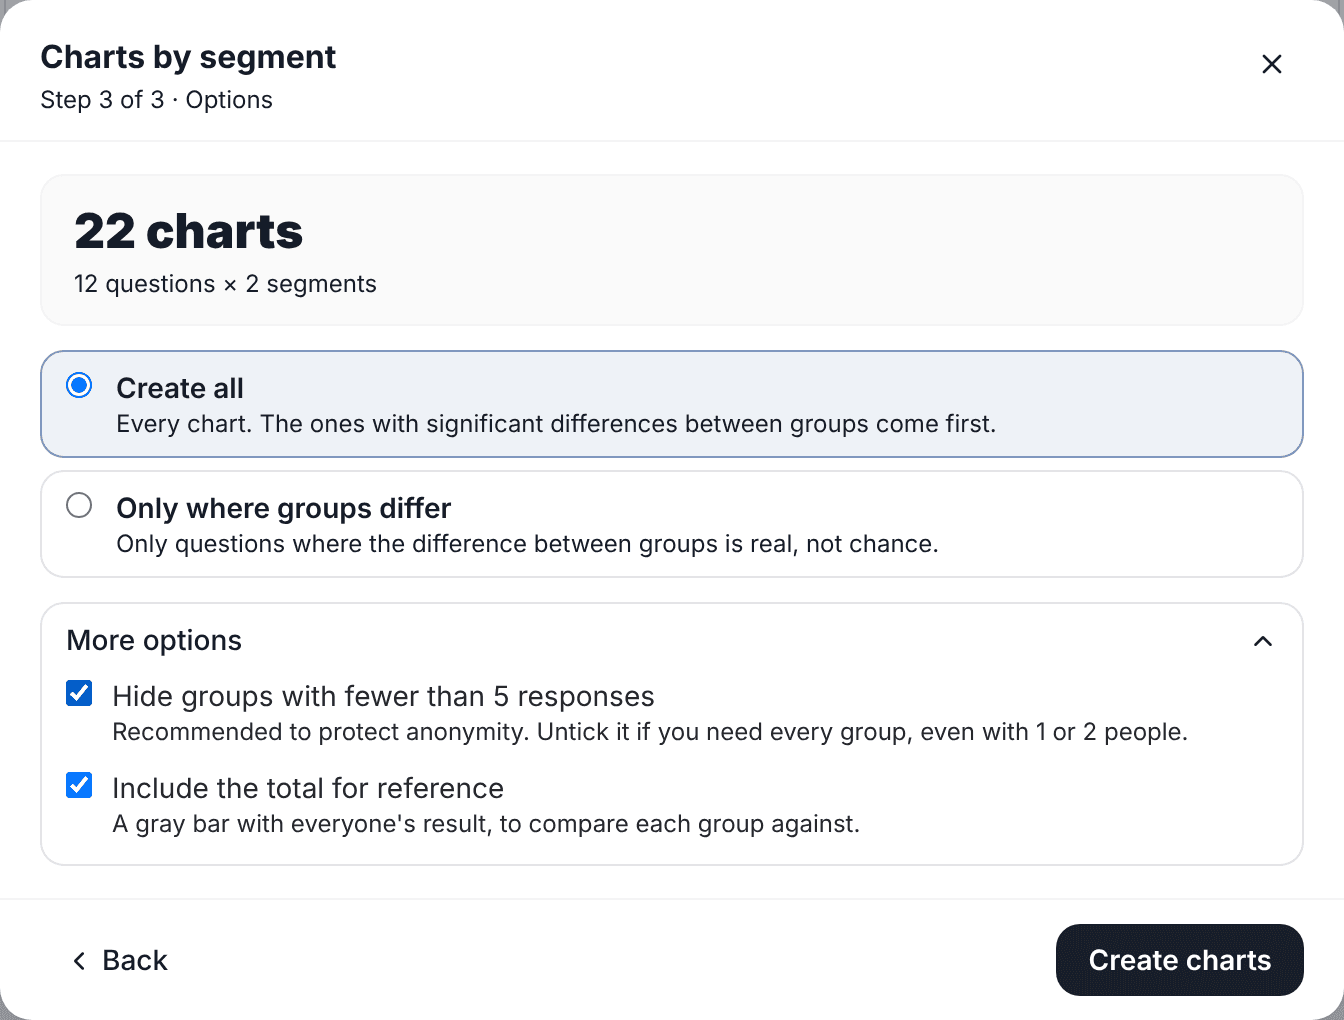
In the last step you choose whether you want every chart or only those showing a significant difference between groups. Under More options there are two more settings: hiding groups with fewer than 5 responses (on by default, and you can turn it off) and showing the Total bar.
What you get
SurvIQ creates a new page in the advanced results with a heading per segment and all the charts below. Questions where groups really differ come first and carry a "Significant difference" label. The Total is gray so it isn't mistaken for a group, and under each chart you can see which groups are hidden for being too small.
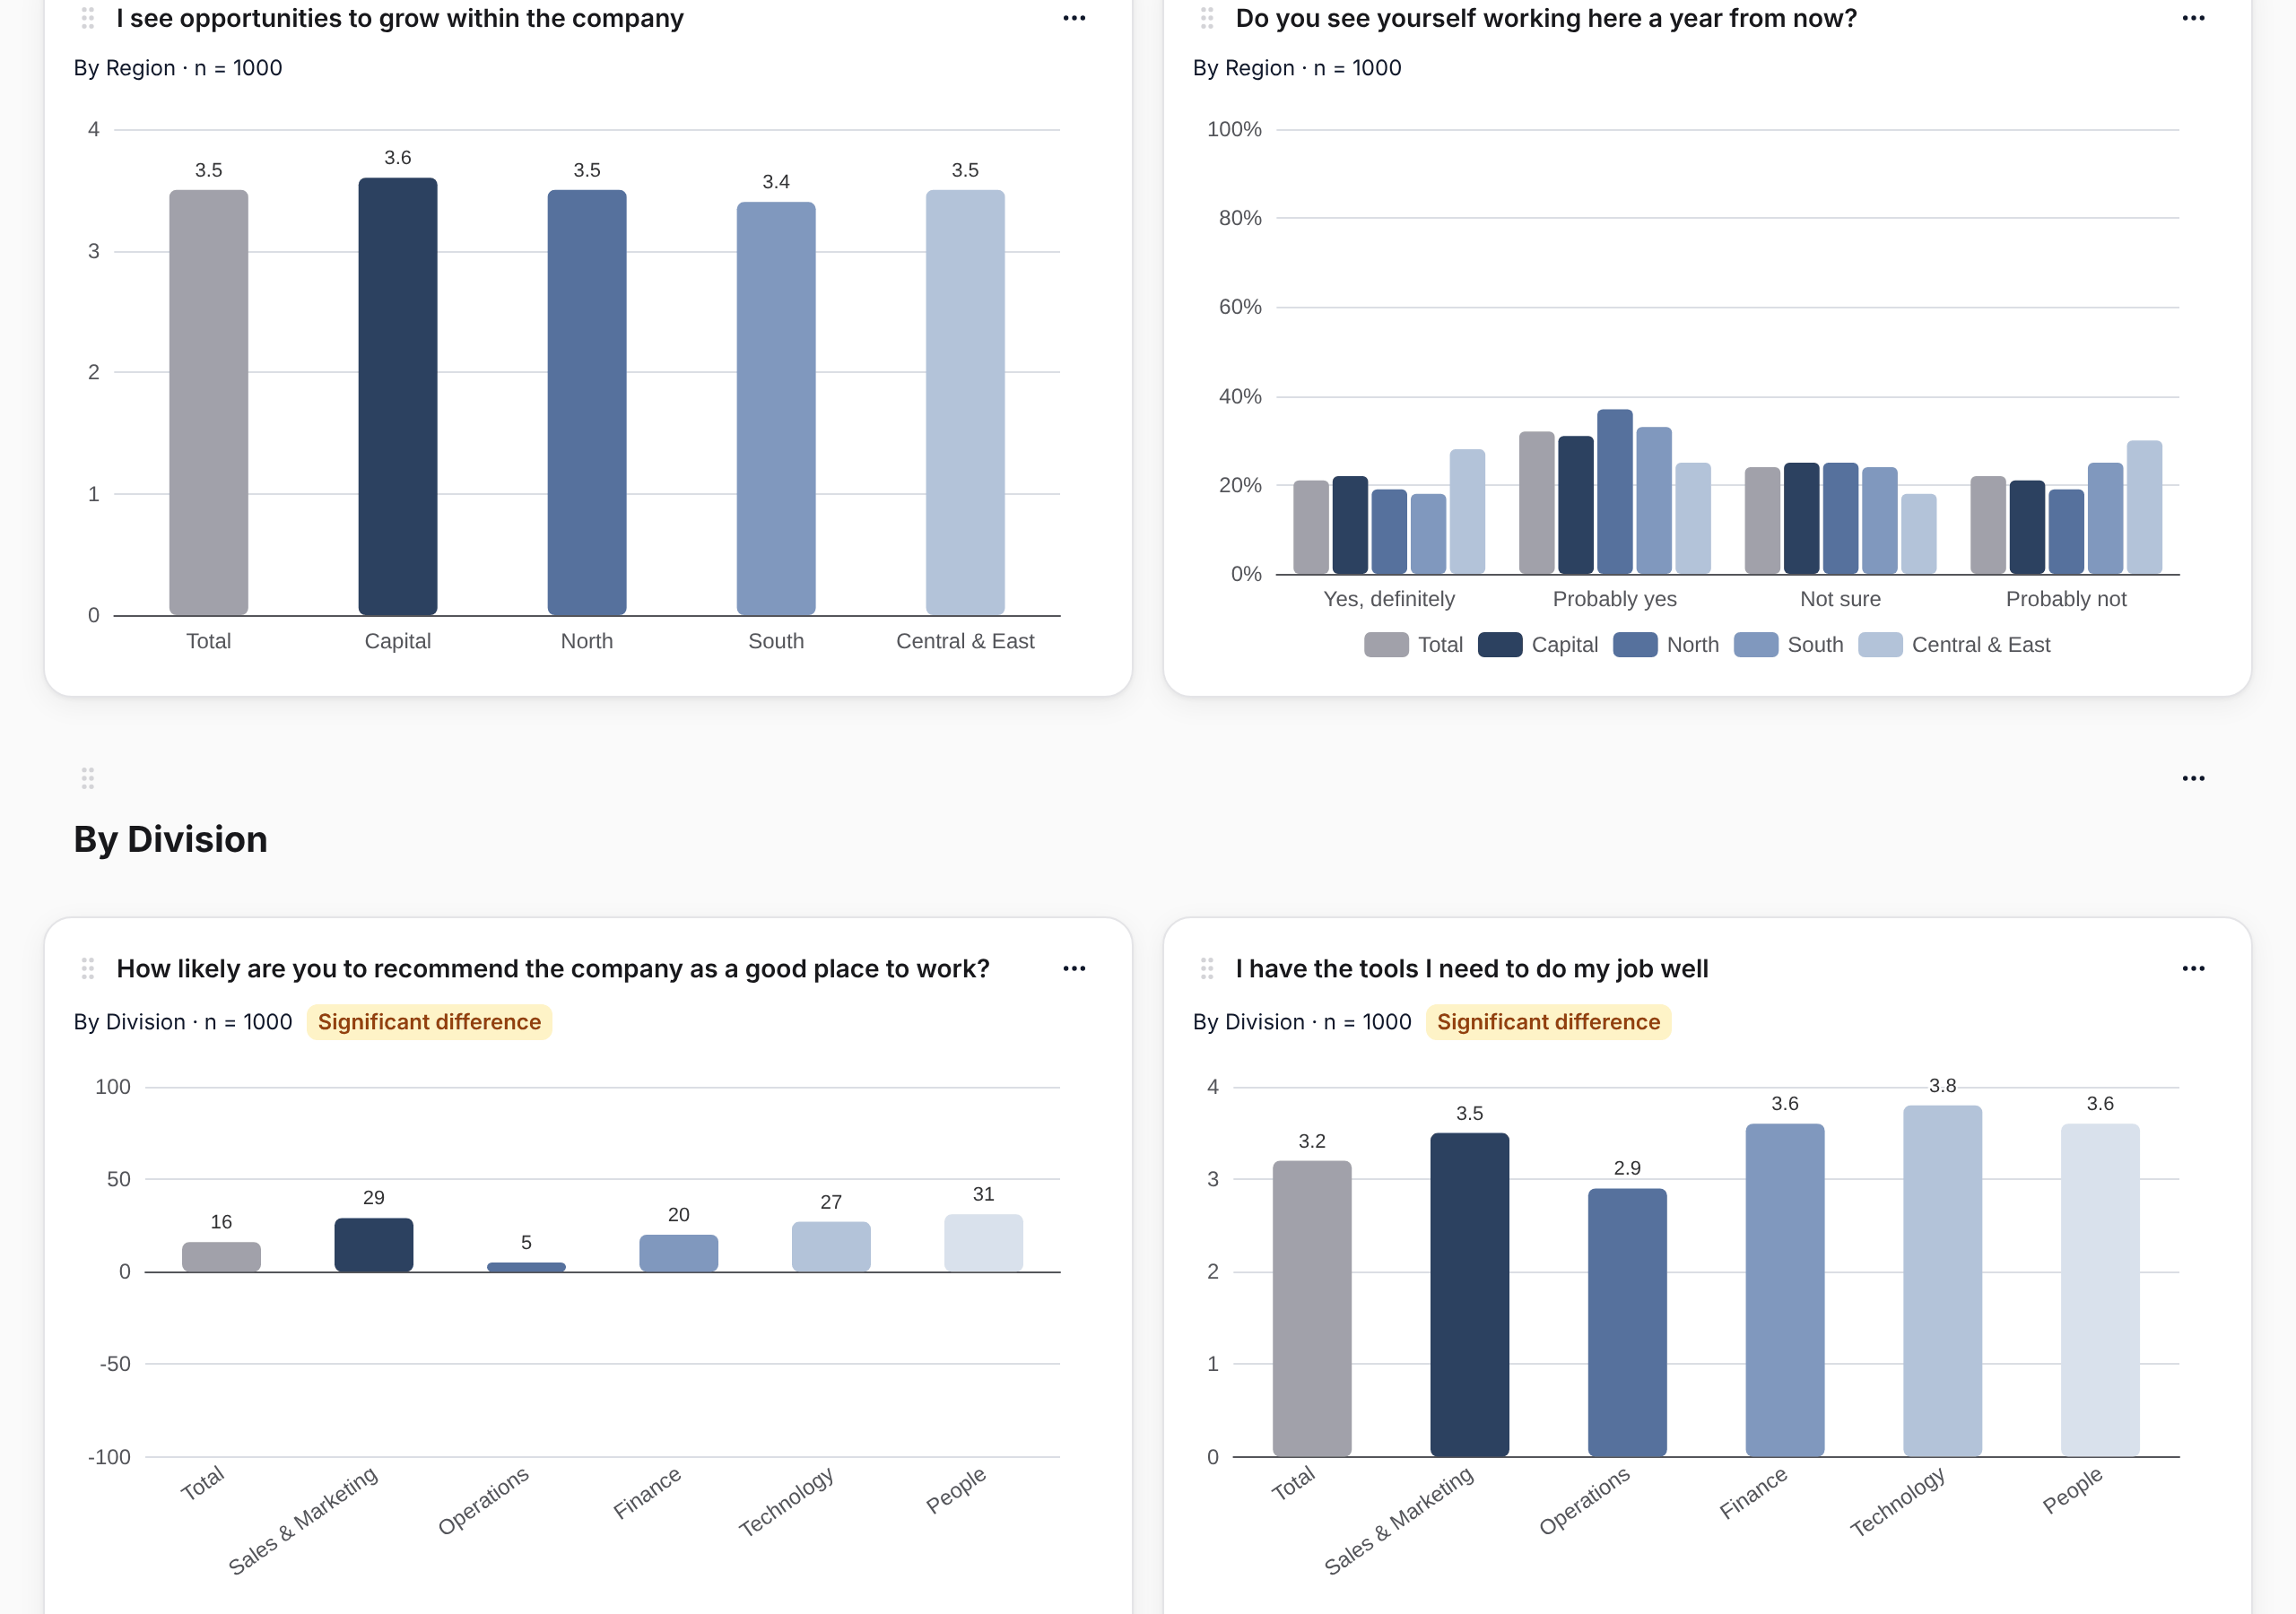
Every chart can be edited afterwards: change the type, the title or show the small groups again. If you apply a filter at the top (for example, only the Lima site), every chart on the page is recalculated with it.
Taking it to a presentation
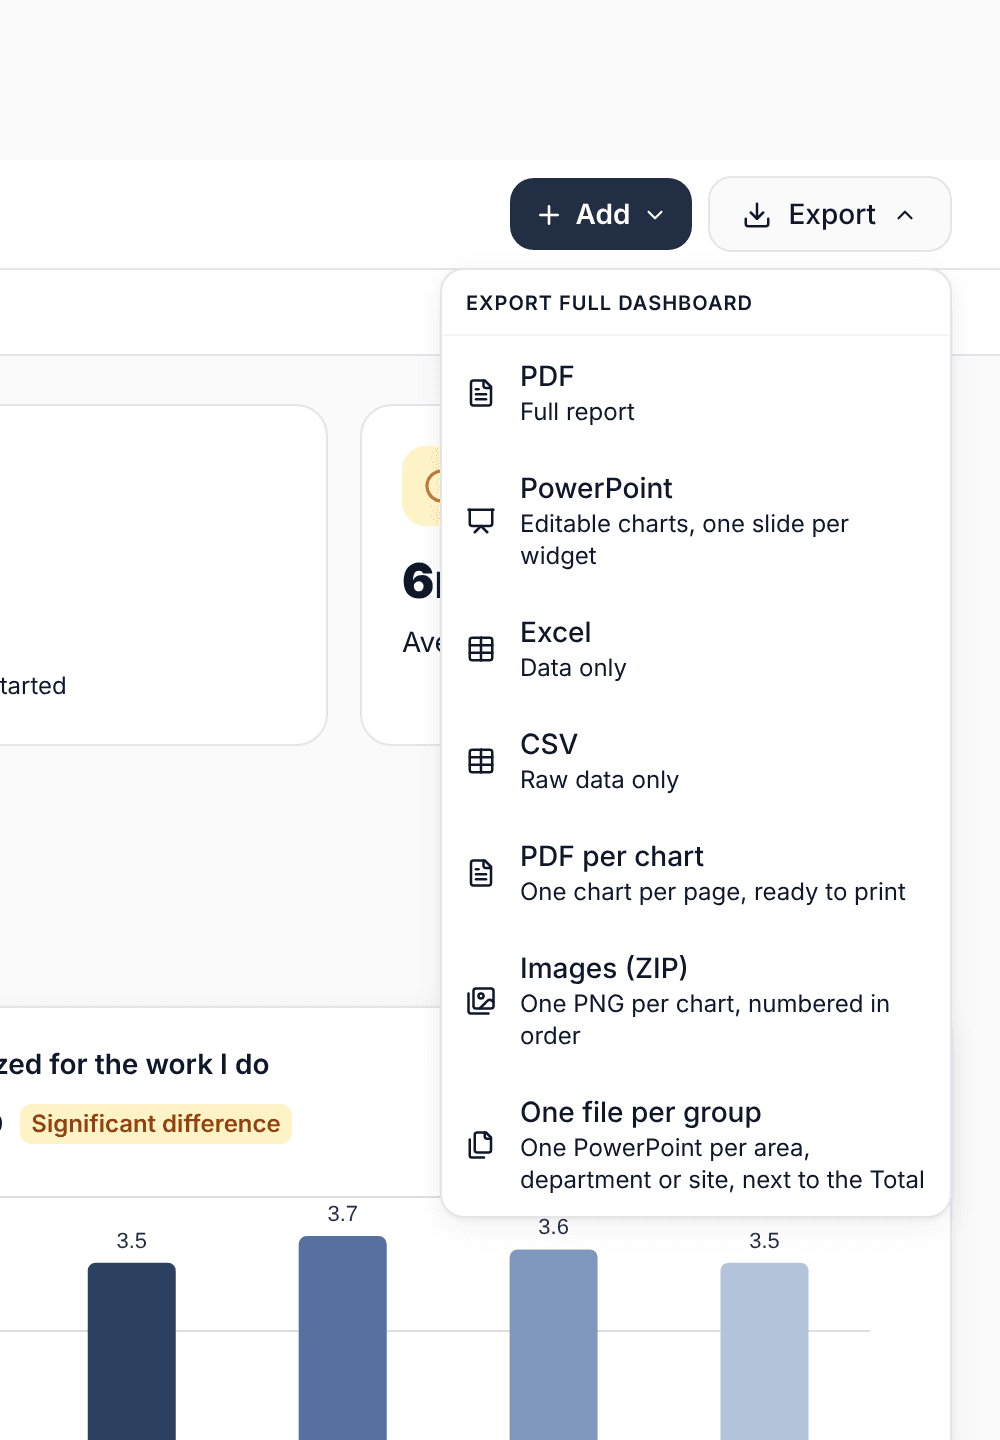
The page exports in several ways, depending on who it's for:
- PowerPoint with one chart per slide. The charts are native PowerPoint charts: you can change colors, text and data without going back to SurvIQ.
- PDF with one chart per page, ready to print or attach.
- Images in a ZIP, one per chart and numbered in page order, to paste into your own report.
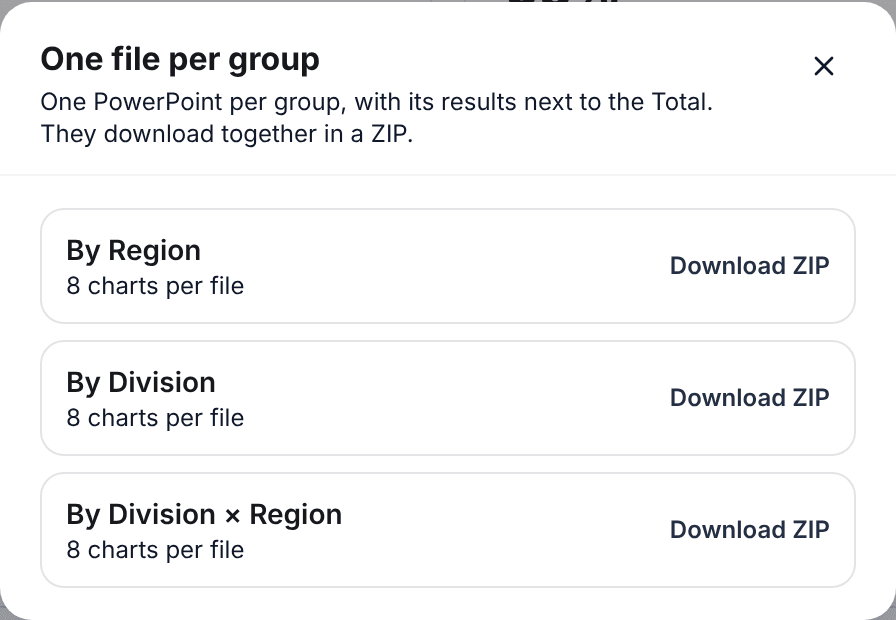
- One file per group: a PowerPoint for each department (or team, or site) with its results next to the Total. Each manager gets only theirs.
Before you present
- Start with the charts marked as a significant difference. Those are the ones worth explaining.
- Check each group's n. A big gap in a group of 6 people can be a single person.
- Don't show very fine crosses in confidential surveys. "Legal · Woman · 10+ years" can be one person even if the group had 5 responses overall.
- Pair each chart with one sentence: which group moves away from the Total and what will be done about it.
You can explore the advanced results with sample data, no account needed:
Try the results demo