How to build an internal communication survey report, slide by slide
 By Enzo CaminoPsychologist and founder of SurvIQ
An internal communication survey measures three different things: whether the messages landed (knowledge), how they arrived (channels) and what people think of how the company communicates (perception). Mixing them in the report confuses people. Separating them, and looking at them by department, is what makes the report useful for decisions.
1. Participation
First slide: how many responded, overall and by department, with the margin of error. If a department barely responded, everything after that about the department needs to be read with care.
2. Knowledge of key messages
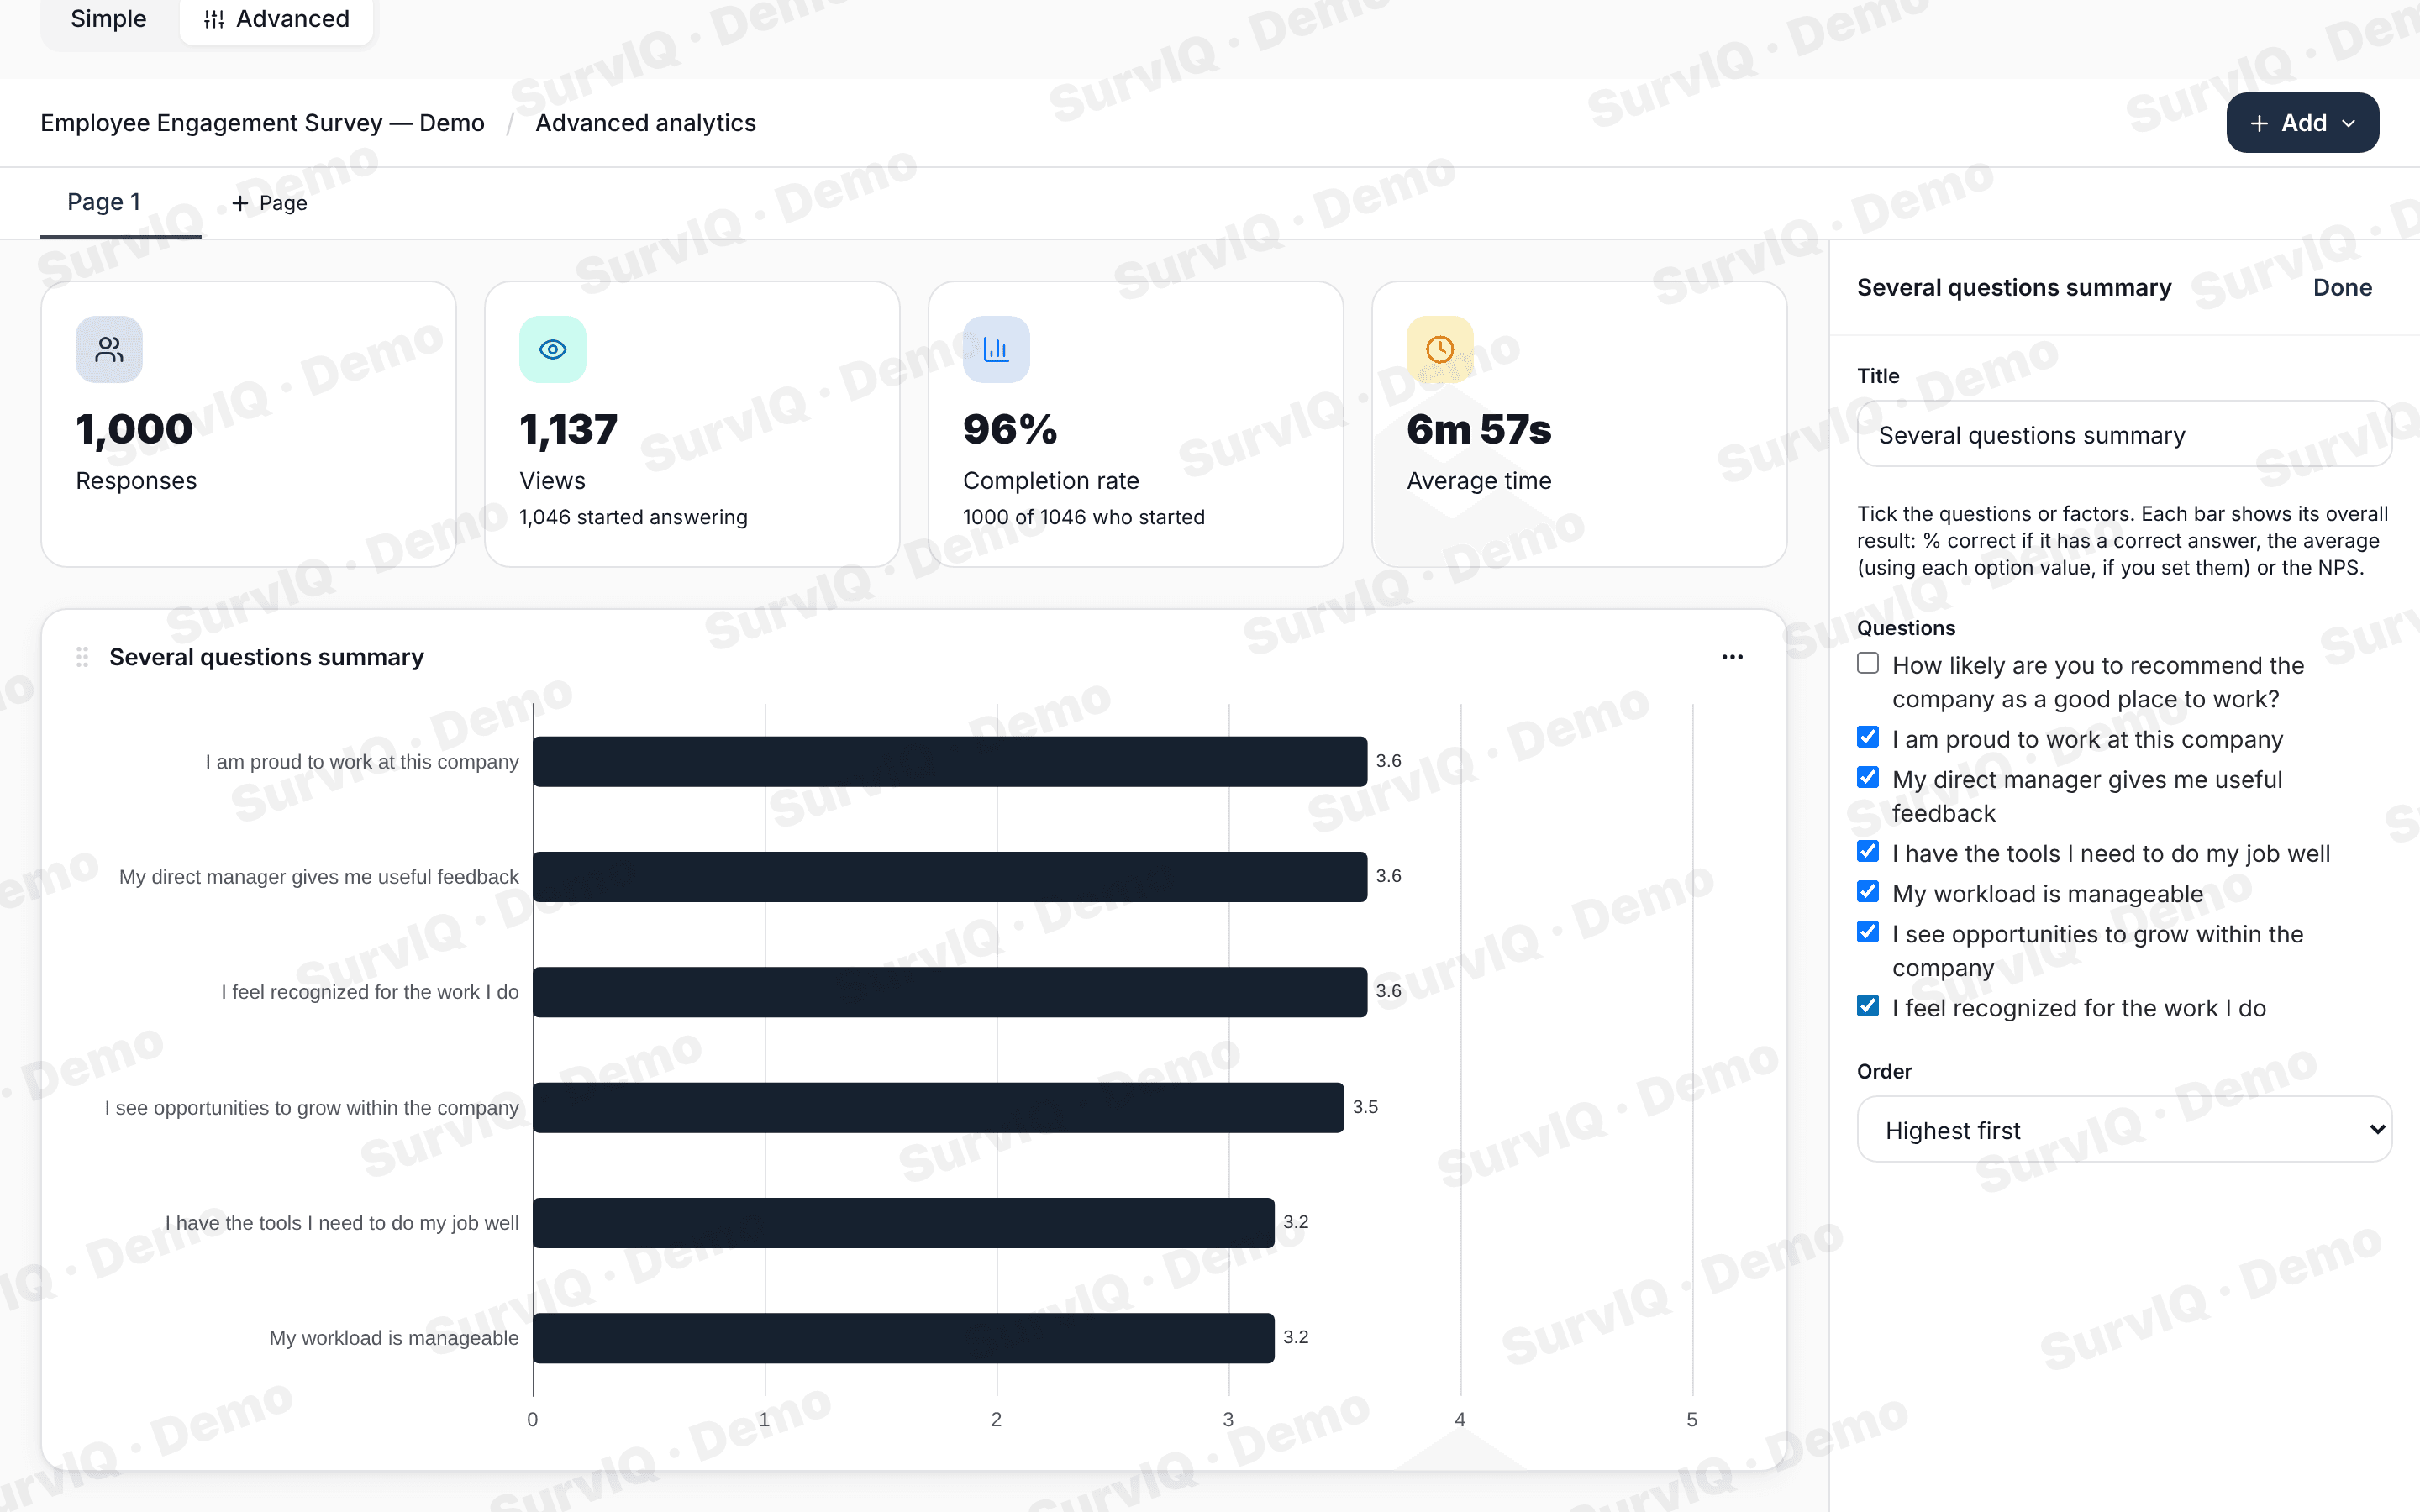
Questions with a correct answer: "What is the official channel to request time off?", "Which benefit launched this year?". The figure that matters is the % correct of each question, side by side, and then the same % by department to see where the message didn't land.
3. Channels
How people hear about things (email, intranet, direct manager, chat, notice boards) and how they would rather hear. These are usually multiple-choice questions: with many departments, a table with the % of each channel per department reads better than grouped bars.
4. Perception and favorability
Statements on an agreement scale ("I hear about changes that affect me in time"). They are shown as an average or % favorable, grouped into factors: clarity, timeliness, manager communication. A factor table by department sums up the whole section on one slide.
5. Differences by department
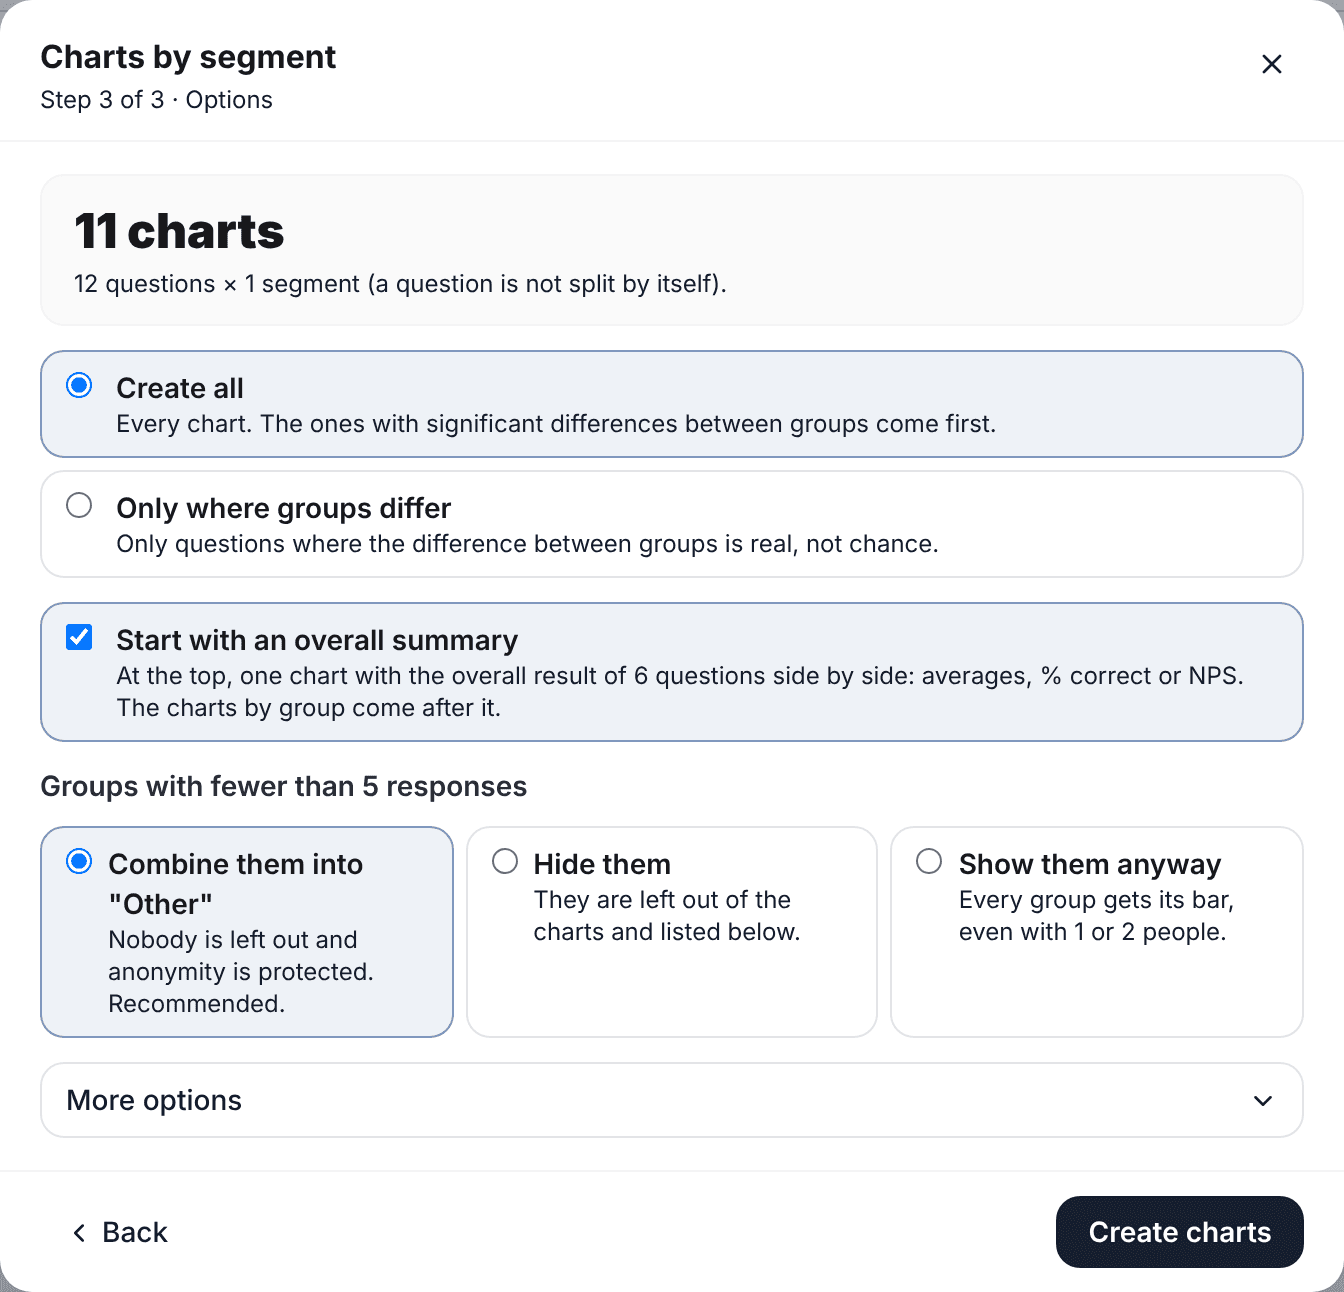
Each question by division or region. You don't need all of them: highlight the ones with a real difference between groups and leave the rest in an appendix. Groups under 5 people go together in "Other" to protect anonymity.
6. Comments
Open answers grouped by theme with their percentage and two or three verbatim quotes. It is what people remember most from the report.
How to get it in SurvIQ
- If the survey ran on another platform, import the Excel or CSV of responses.
- Mark the correct answer on the knowledge questions.
- Add Participation by group, the Several questions summary and Charts by segment.
- Export the page to PowerPoint with editable charts, and write the finding for each slide.
To get every slide by department at once:
Charts by segment