How to get every chart by department at once
Updated November 18, 2026
An engagement or satisfaction report usually repeats the same slide: each question by division, by region, by tenure. Charts by segment builds them all in one step, with an overall summary chart on top, on a dashboard page ready to export.
Step 1: choose the questions
- Open the results and switch to Advanced.
- Tap Add and choose Charts by segment (under "Many at once").
- Check the questions you want to chart, or leave them all.
Step 2: choose what to split by
Check one or more segments: Division, Department, Region, an age range, a hidden field or a grouped question. If you check two, you can also cross them (for example Region × Gender).
Step 3: options
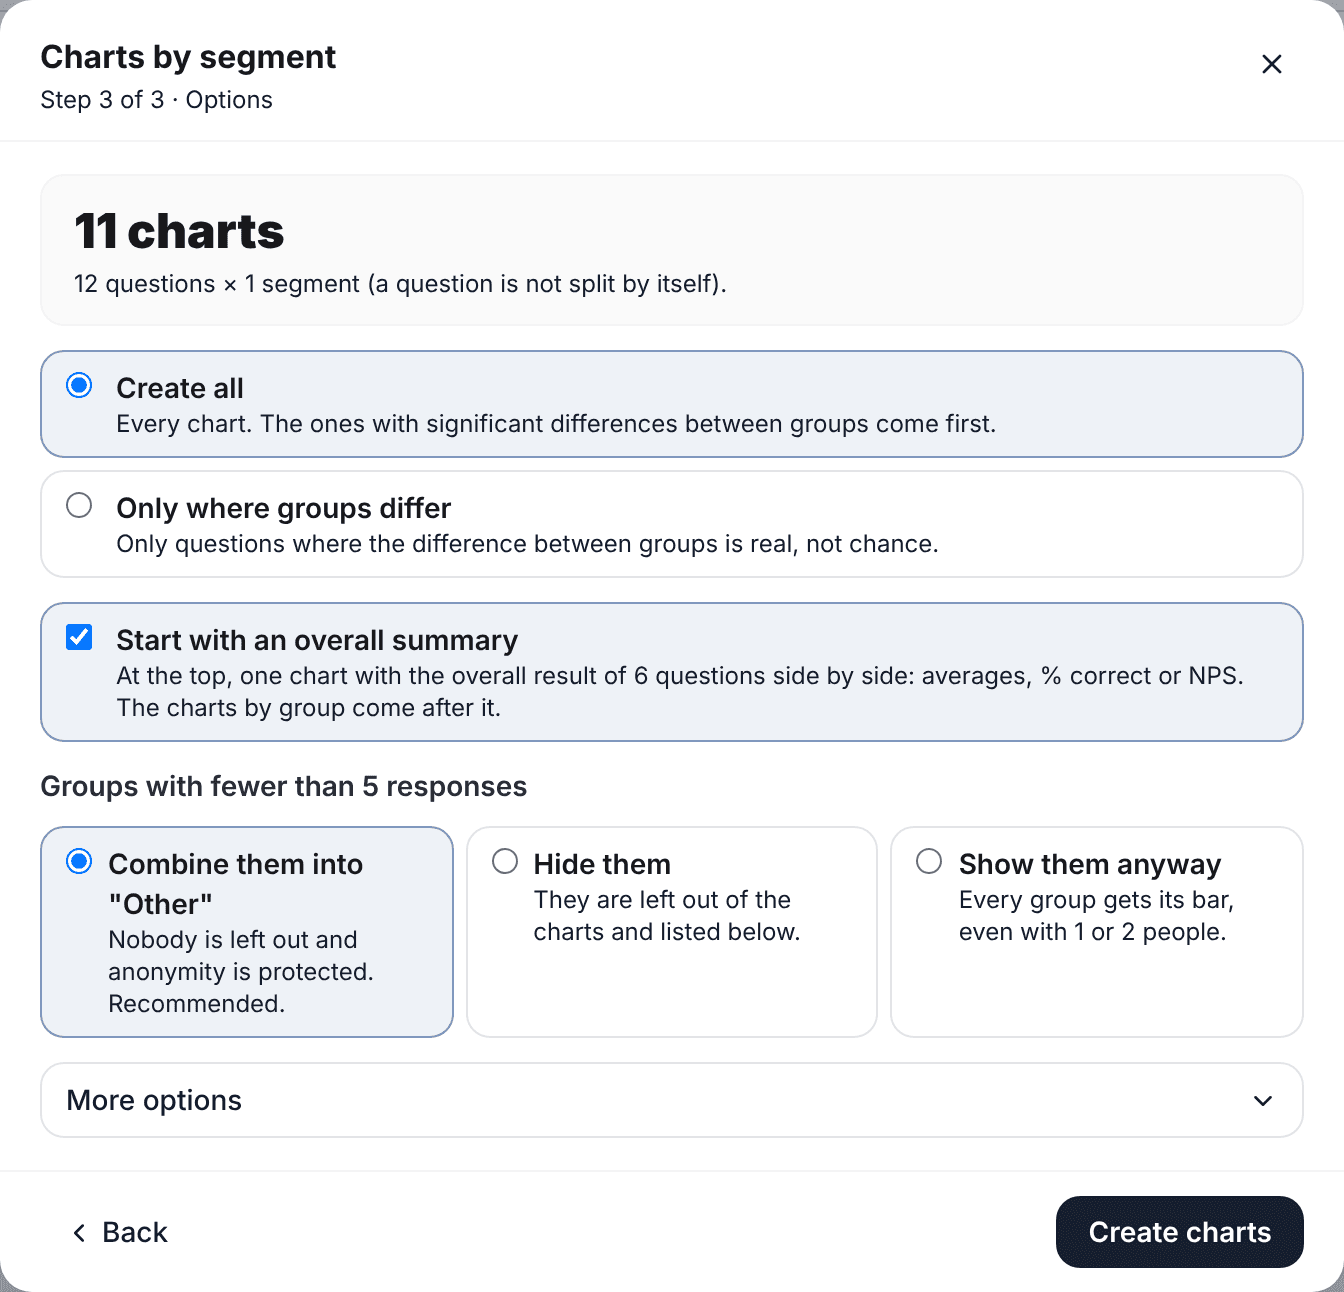
- Generate all, or only the questions where the difference between groups is real and not chance.
- Start with an overall summary: at the top, one chart with the overall result of the questions side by side (average, % correct or NPS). If they use different scales, you get one summary per scale.
- Groups with fewer than 5 responses: combine them into "Other" (recommended), hide them or show them anyway.
Tap Create charts. A new dashboard page opens with the overall summary and then one block per segment.
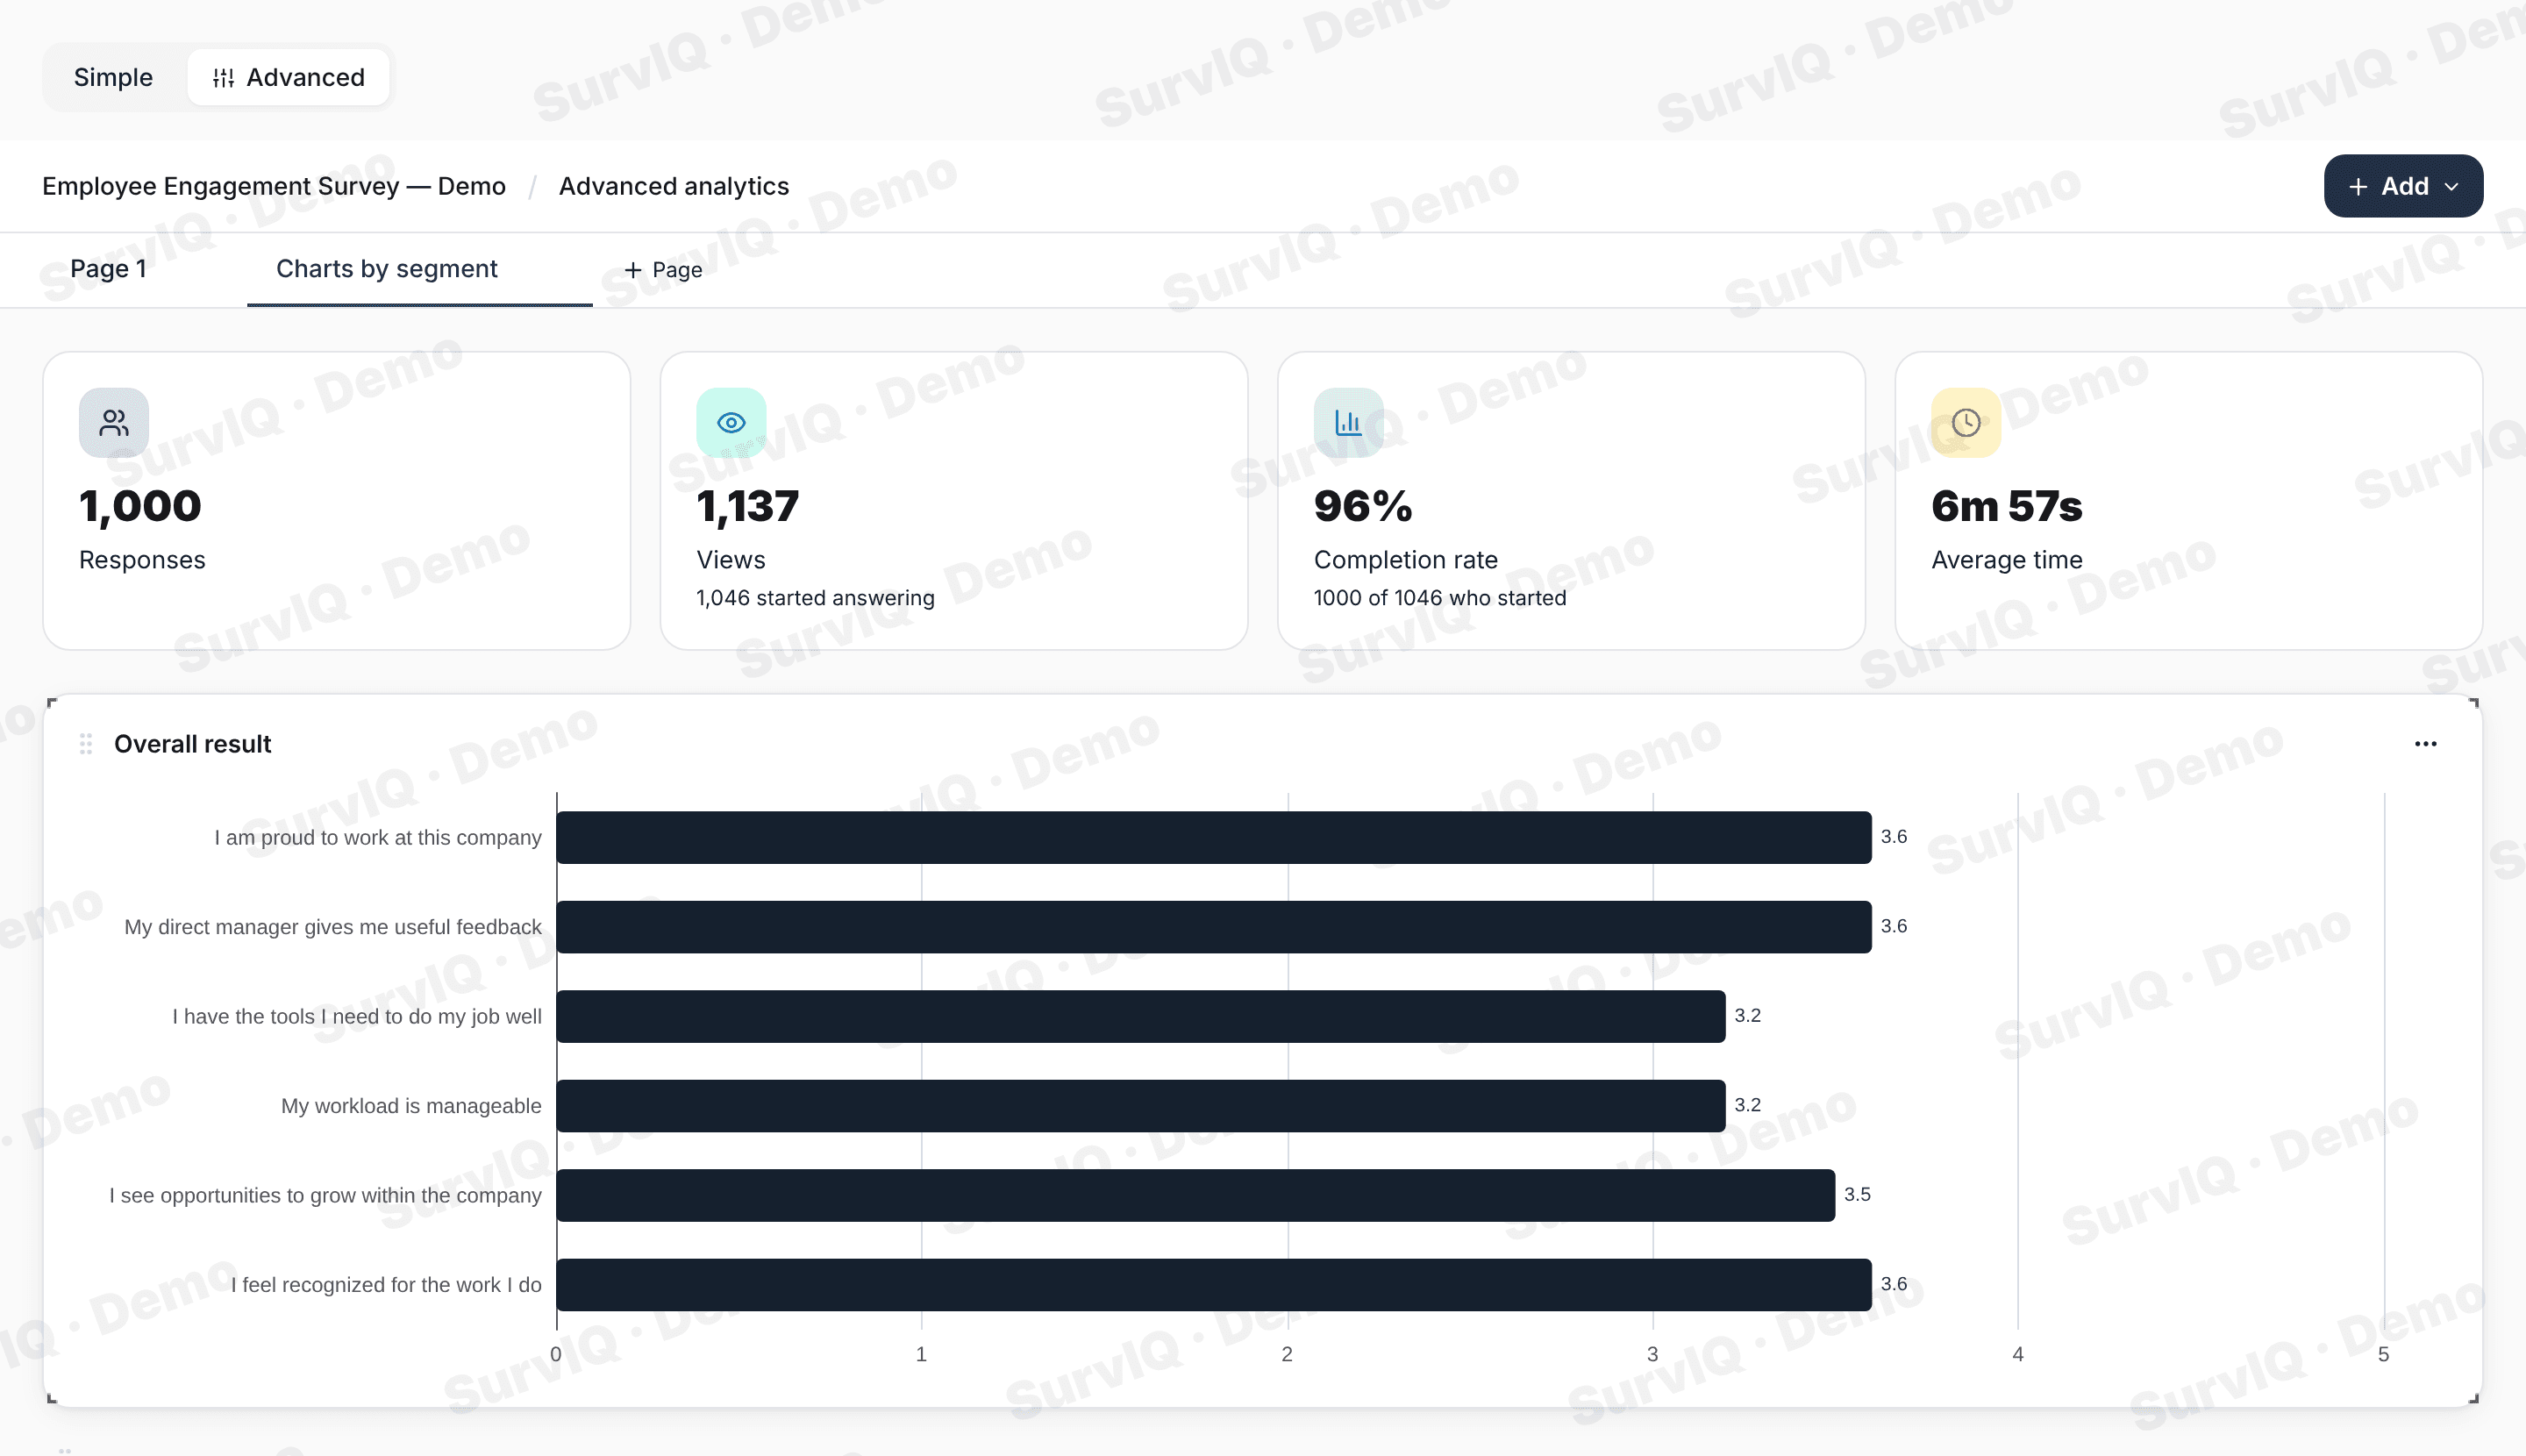
How the charts look
- Scales and NPS: one bar per group with its average or NPS, and the Total in gray.
- Single choice with more than 5 groups: 100% stacked bars, one per group, so they stay readable.
- Multiple choice with many groups: a table with the % of each option in each group.
- Knowledge questions: Correct / Incorrect per group.
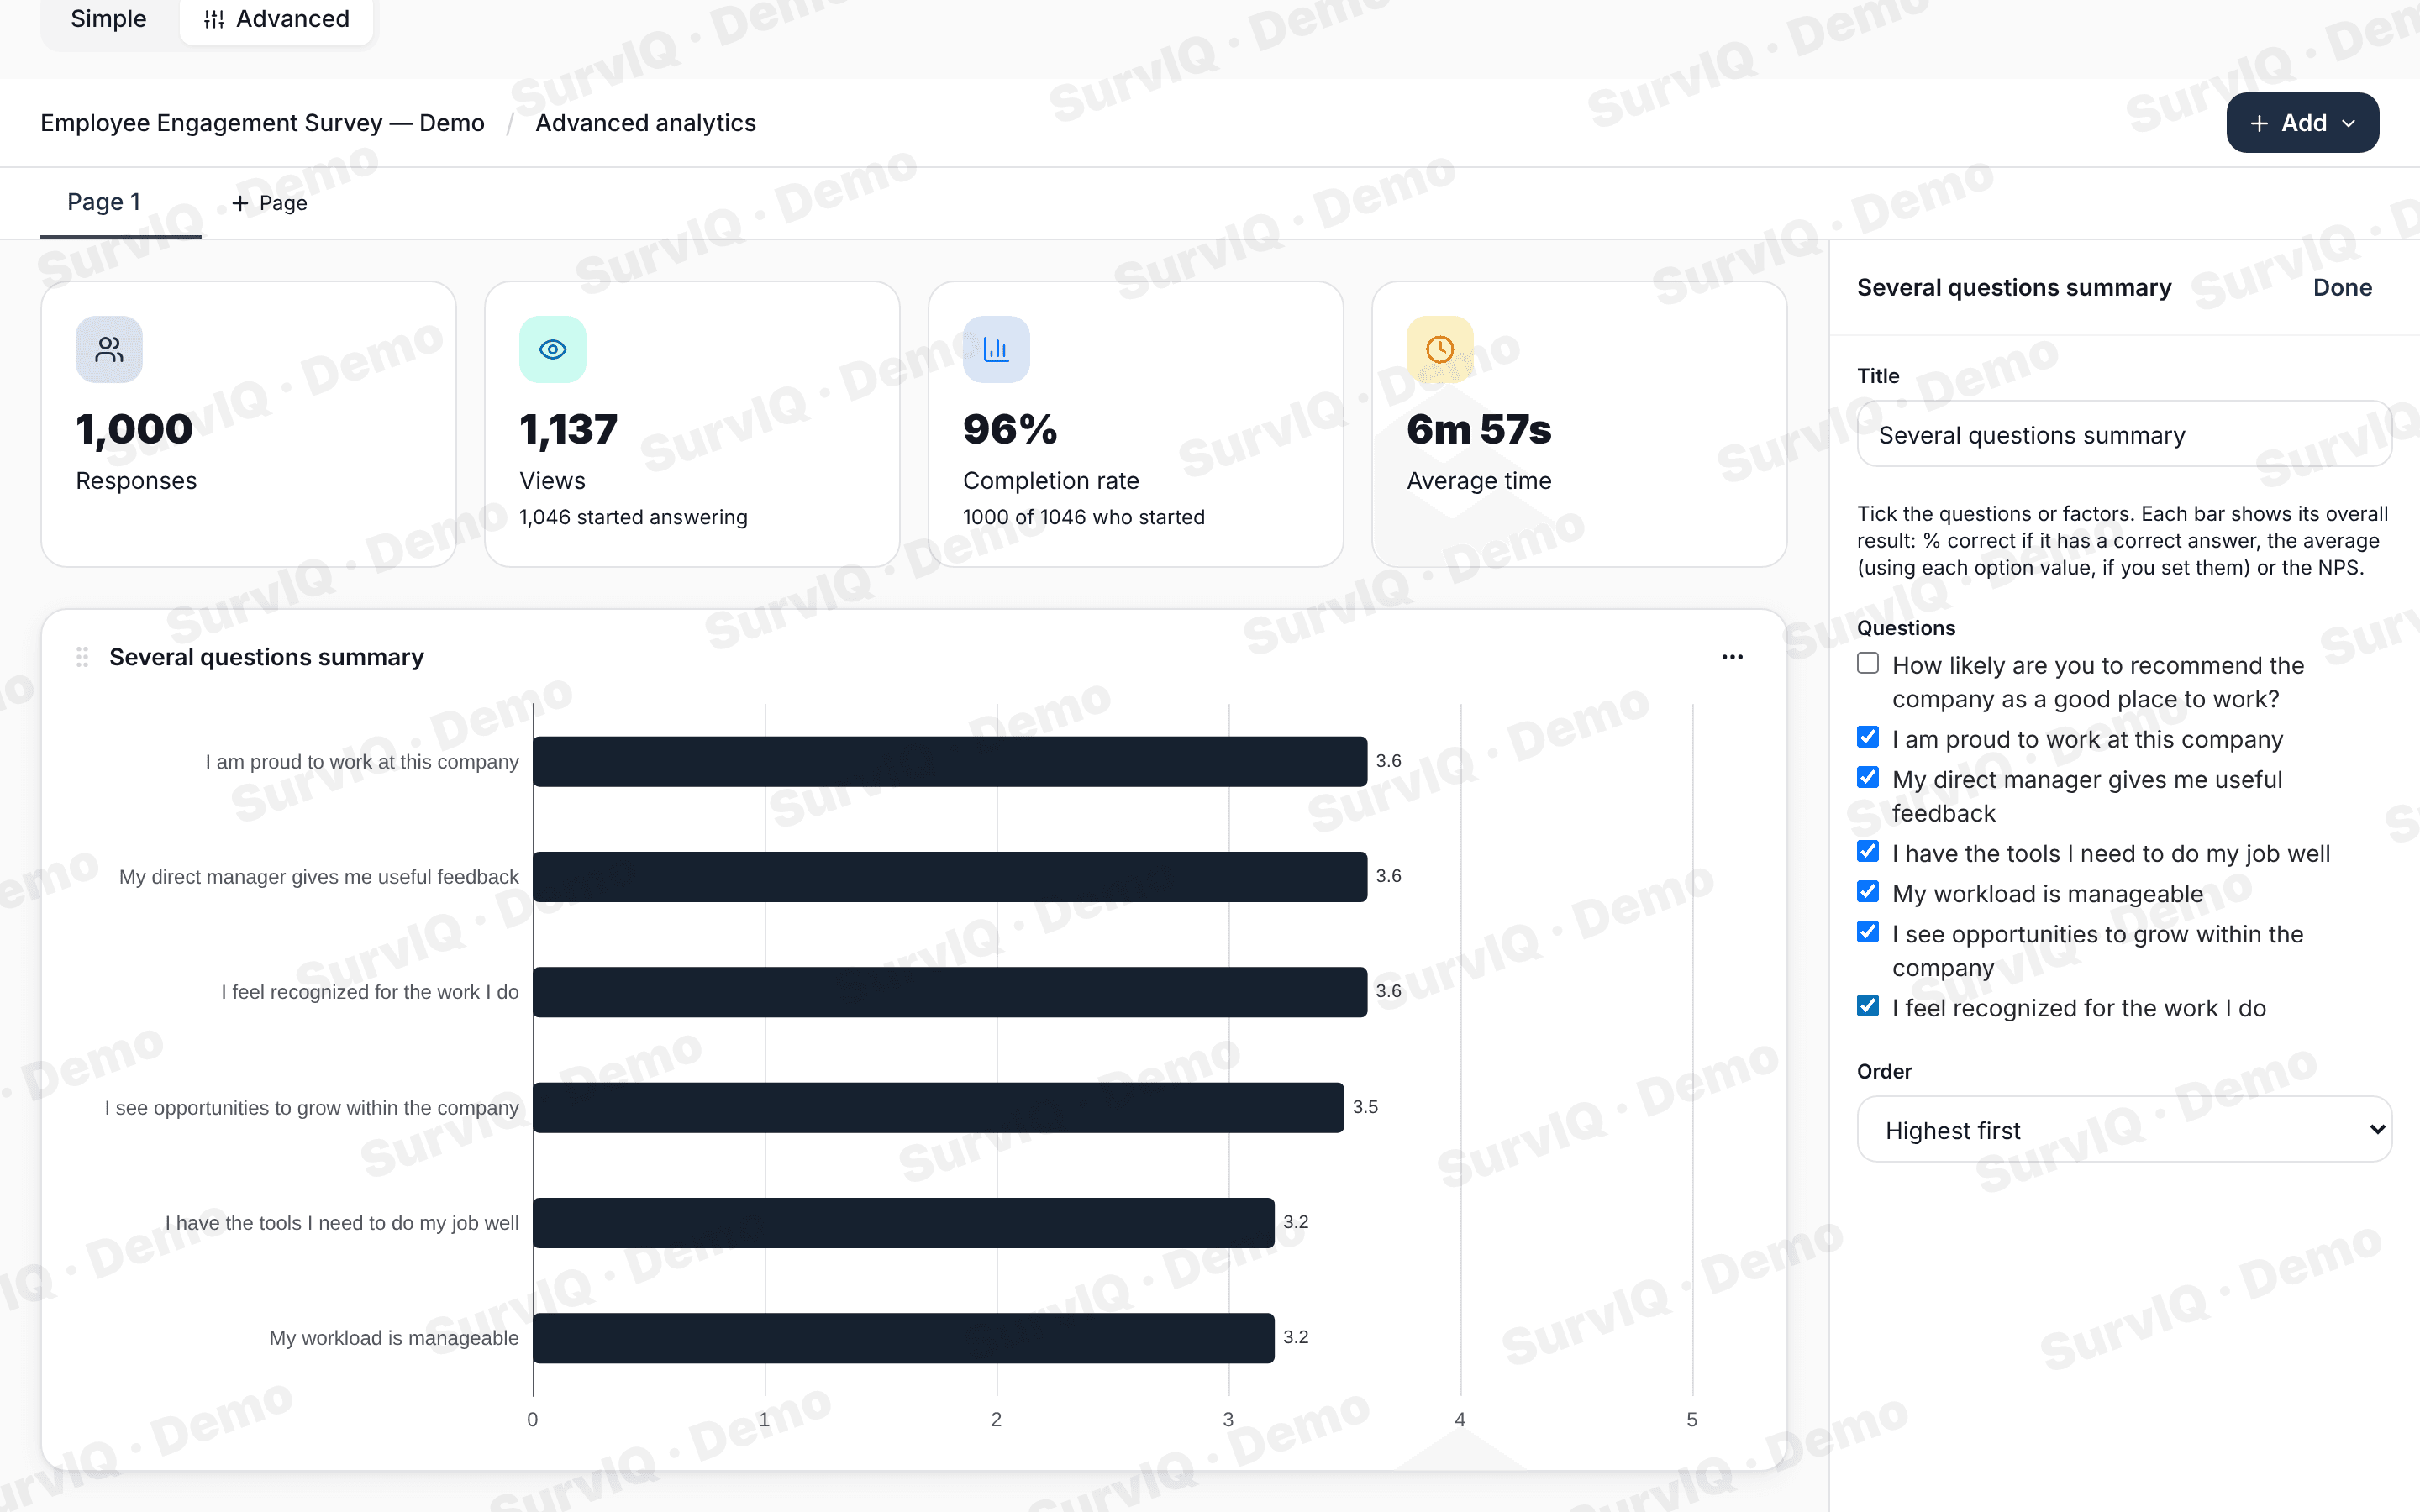
The summary on its own
If you only want the summary, choose Several questions summary in Add. Check the questions or factors and the order (survey order or highest to lowest).
Export
The whole page exports to PDF or PowerPoint. You can also get one file per group: a PDF for each division with its own charts.
Frequently asked questions
Which plan includes it?
Advanced results, including Charts by segment, are available from the Pro plan.
Does it work with responses imported from SurveyMonkey?
Yes. Import the file and use the wizard just like with a survey made in SurvIQ.
You can try it with an engagement survey of 1,000 people, no account needed:
Try it in the demo