Differences between teams in a survey: how to tell when they are real
 By Enzo CaminoPsychologist and founder of SurvIQ
One of the most common conversations after an engagement survey goes like this: team A scored 72% satisfaction, team B scored 64%, and someone concludes that B has a problem. Sometimes that's true. Other times the gap is what you'd expect by chance, and an action plan gets built for a problem that doesn't exist.
You don't need to know statistics to read these differences well. You need three questions: how many people are in each group, how big the difference is, and whether the statistical test says it's real.
1. How many people are behind each number
A percentage from a small group moves a lot with a single response. In a group of 8, each person is worth 12.5 points. If one person in a team of 8 changes their mind, the team goes from 75% to 62.5%. The same change in a team of 200 doesn't show.
That's why every chart by segment in SurvIQ shows the group's n, and why big gaps in small groups deserve more doubt than small gaps in big groups.
2. The 5-response rule
Confidential surveys commonly follow one rule: don't show results for a group with fewer than 5 responses. With 3 people in "Legal", the head of Legal can guess who answered what, and next time nobody will answer honestly.
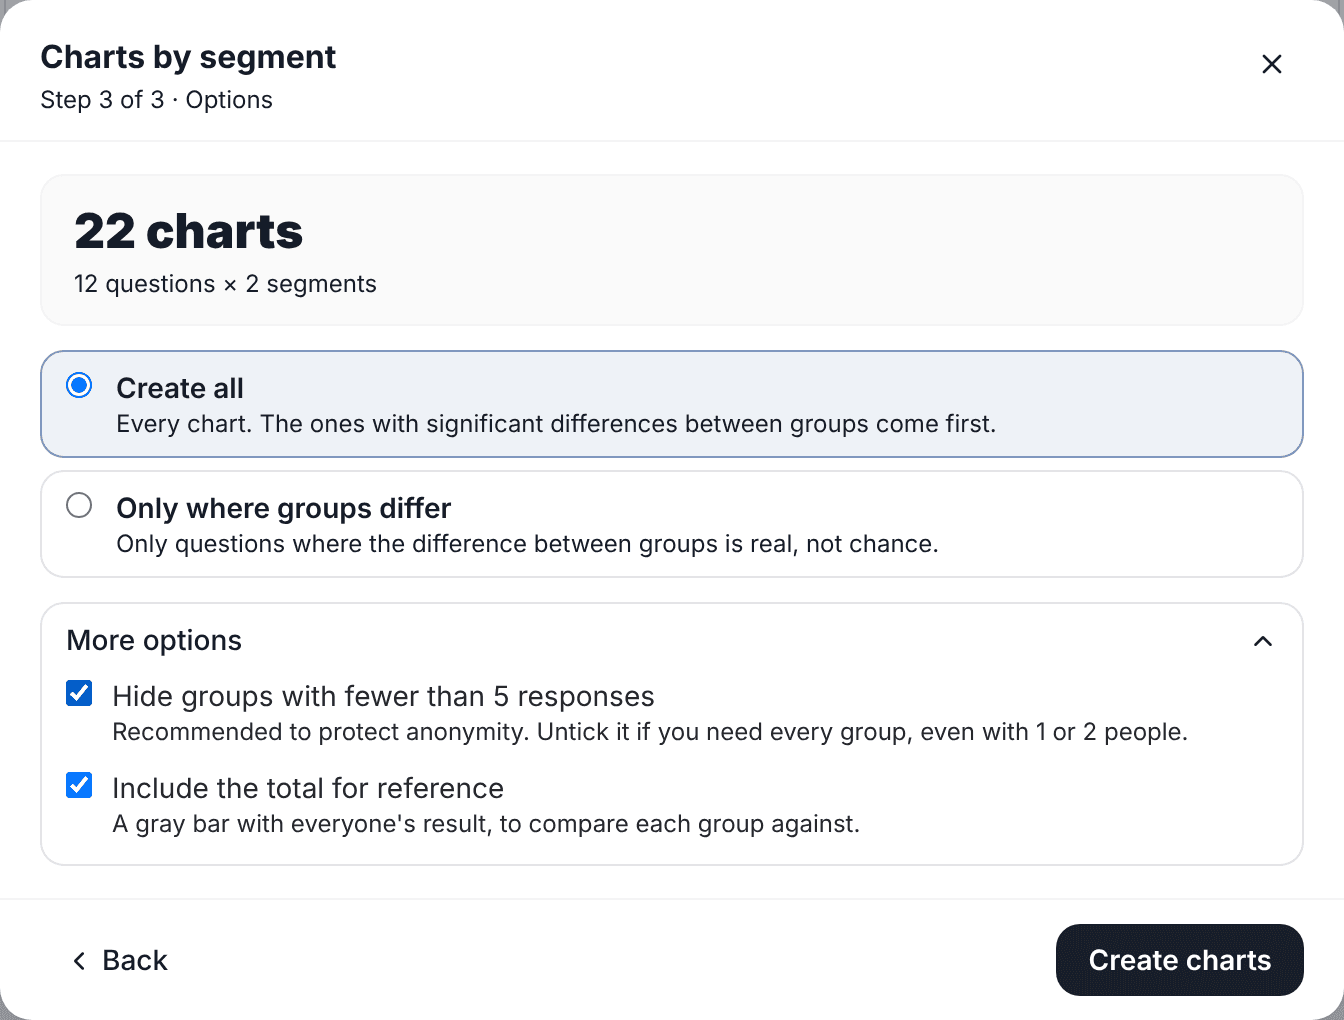
In charts by segment that option comes on by default: groups with fewer than 5 responses aren't charted, and under the chart you can see which ones were left out and how many responses they had. You can turn it off when the survey isn't confidential, for example a customer survey by location.
3. When a difference is significant
A significance test answers one specific question: if every group actually felt the same, how likely would it be to see gaps like these just from who happened to respond? If it's very unlikely (under 5%, the usual convention), the difference is called significant.
- For choice questions (yes/no, picking between options) the chi-square test is used, which compares how answers are spread in each group.
- For scales and averages (satisfaction 1 to 5, NPS) analysis of variance (ANOVA) is used, which compares group averages while accounting for how much answers vary within each group.
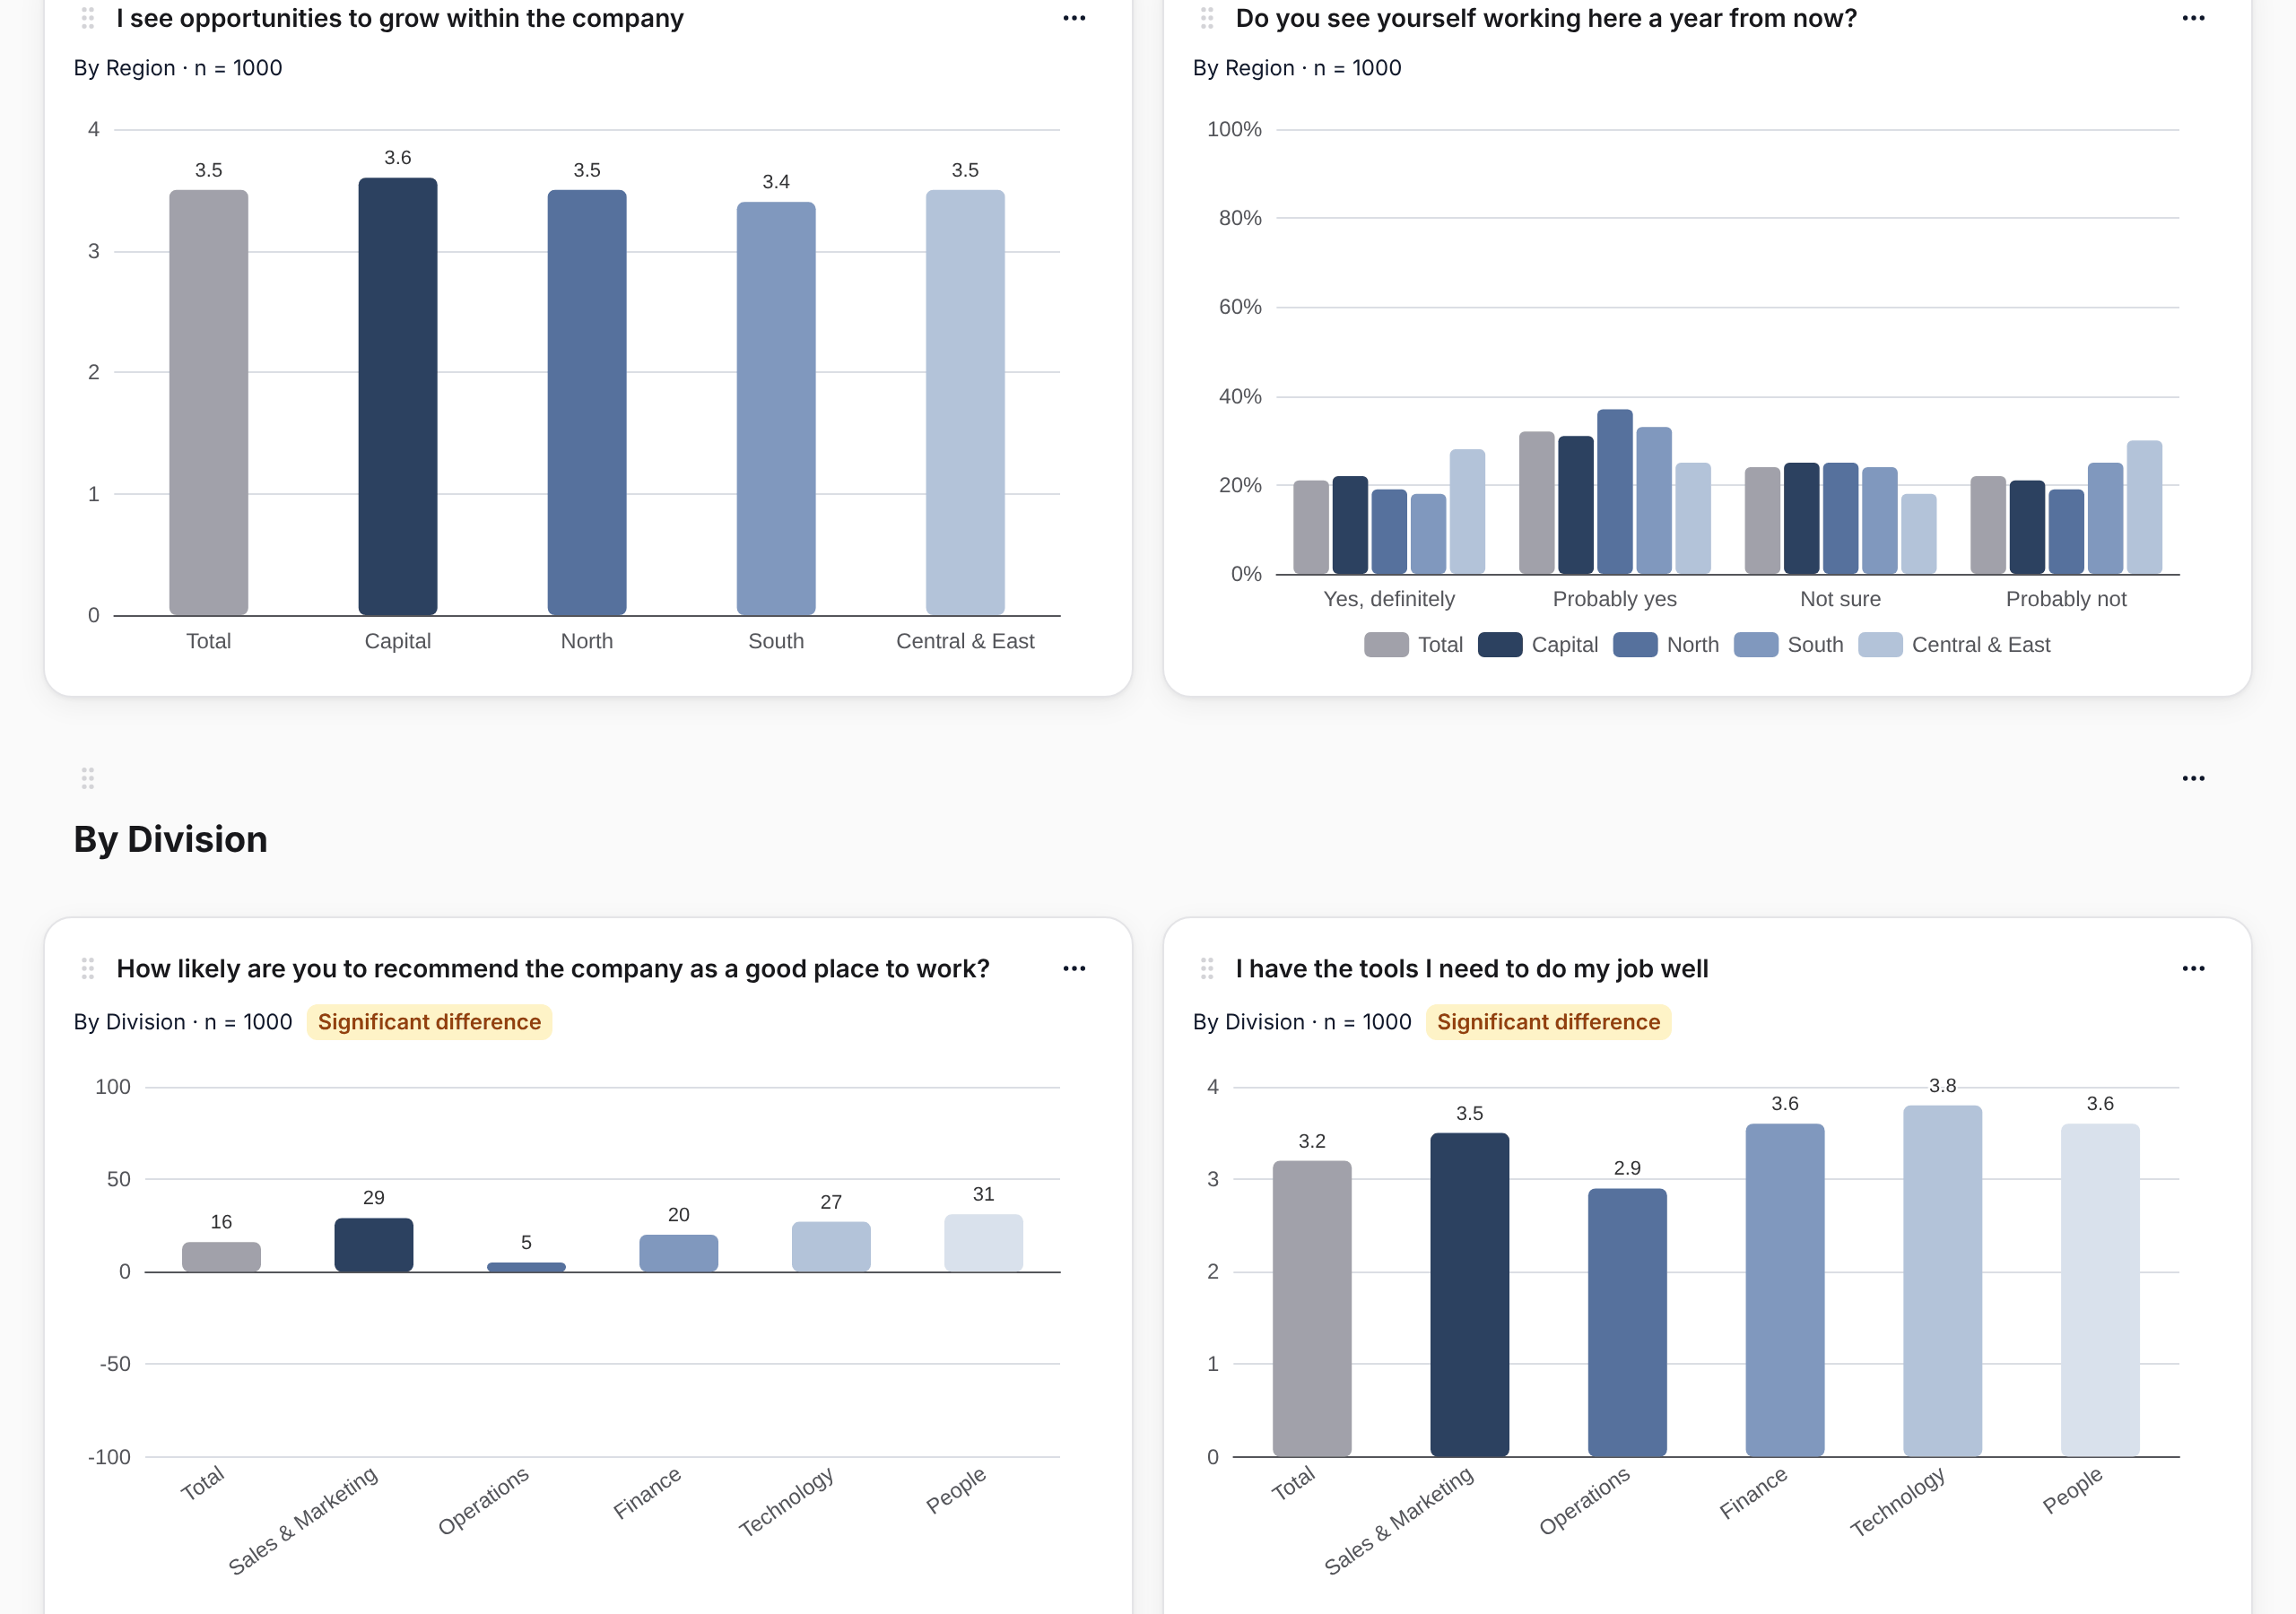
SurvIQ runs the right test for each question on the groups being shown and labels the chart "Significant difference" when there is one. When you generate the page you can ask for only those charts: in a 30-question survey, they're usually the five or six worth discussing.
Significant is not the same as important
With many responses, gaps of 2 or 3 points come out significant. They're real, but they may not change any decision. With few responses the opposite happens: a 15-point gap may not be significant and still deserve a conversation with the team.
The practical rule: the label tells you whether the difference is real; the size of the gap against the Total tells you whether it matters. What's worth taking to leadership is what meets both.
Combined crosses: department × gender
Sometimes a gender gap doesn't exist across the company, but it does in one department. Or a department scores low only because of one shift. To see it you need to cross two segments: each combination ("Sales · Woman", "Sales · Man"…) is a group.
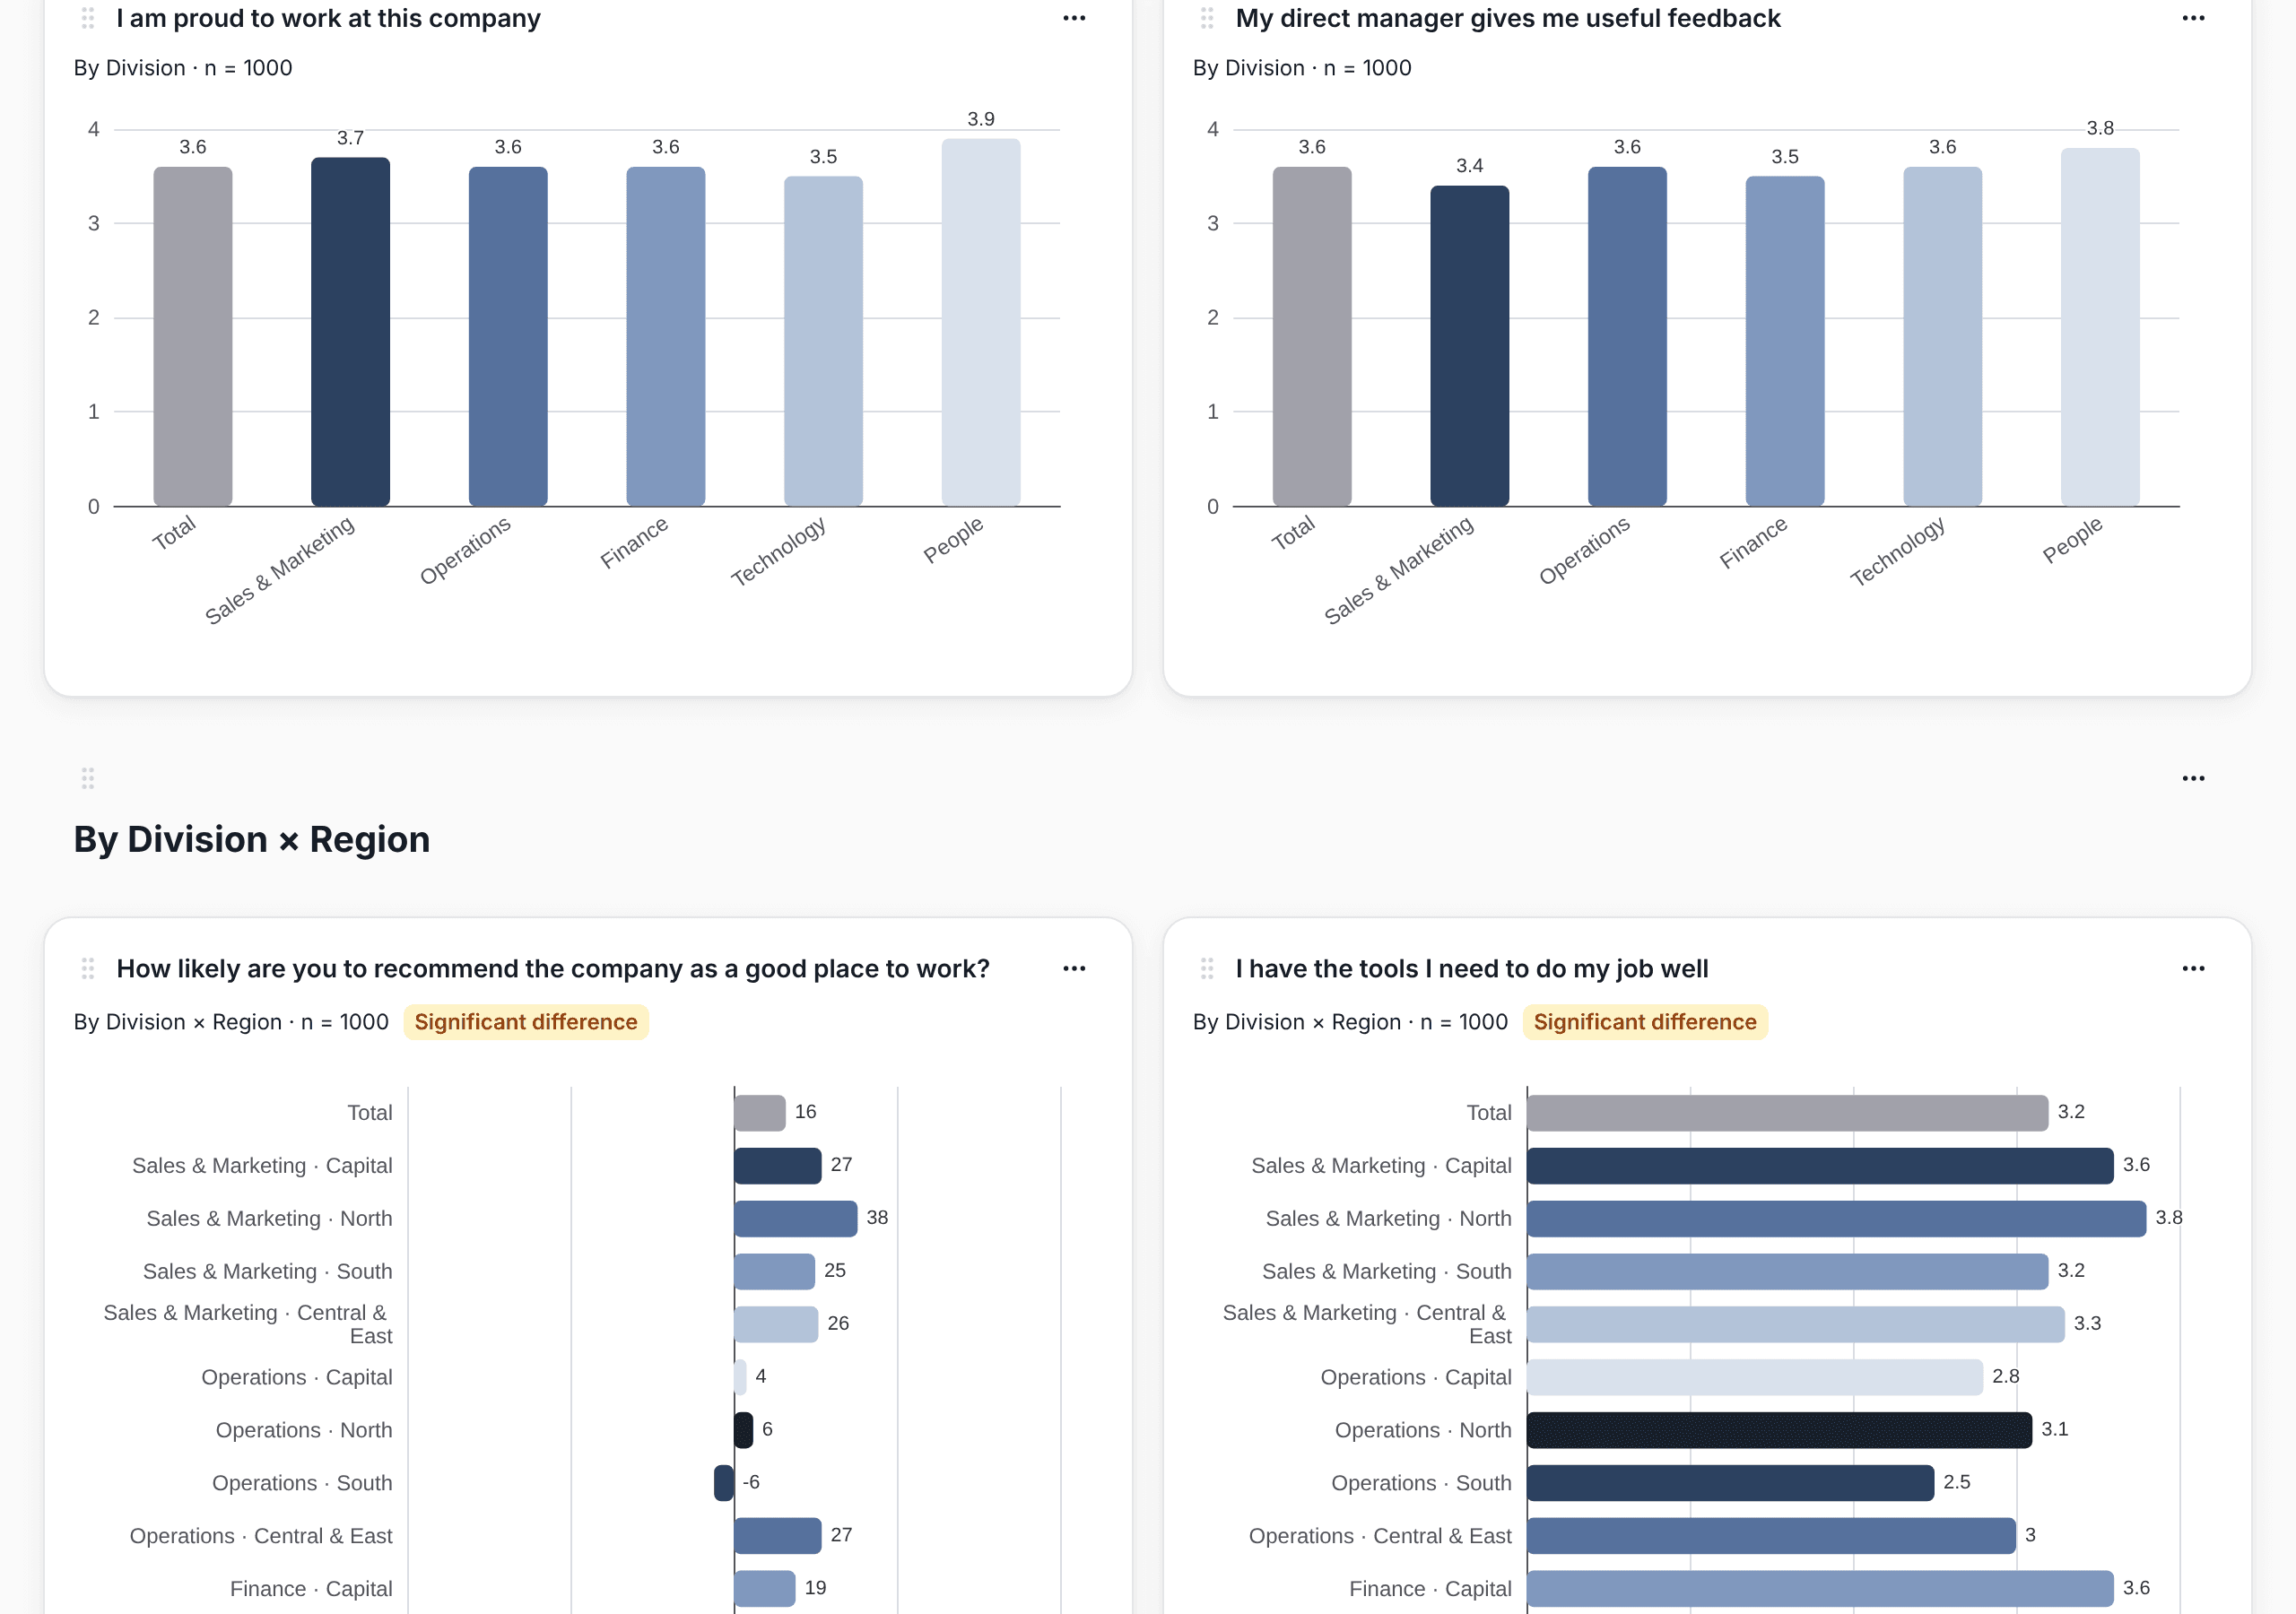
Crosses split fast. 6 departments by 2 genders is 12 groups, and with 150 responses several will end up under 5. Use them to answer a specific question, not to explore everything against everything, and keep the 5-response rule when the survey is confidential.
A checklist for your next meeting
- Look at n first. If the group is small, any difference is fragile.
- Hide groups under 5 in confidential surveys.
- Start with the questions that show a significant difference.
- Of those, keep the ones with a big gap against the Total.
- Use crosses to confirm a hunch, not to hunt for surprises.
- Give each manager only their team next to the Total: "One file per group" produces one PowerPoint per team in a single step.
Step by step to create every chart by segment at once:
How to get your charts by department, team and gender