How to read a factor table by department (and what not to conclude from it)
 By Enzo CaminoPsychologist and founder of SurvIQ
A factor table by department puts in one view what used to be dozens of charts: one row per factor (Leadership, Engagement, Working conditions…) and one column per department or division. It is the slide that gets the most discussion in an engagement survey presentation, and also the one that invites the most rushed conclusions.
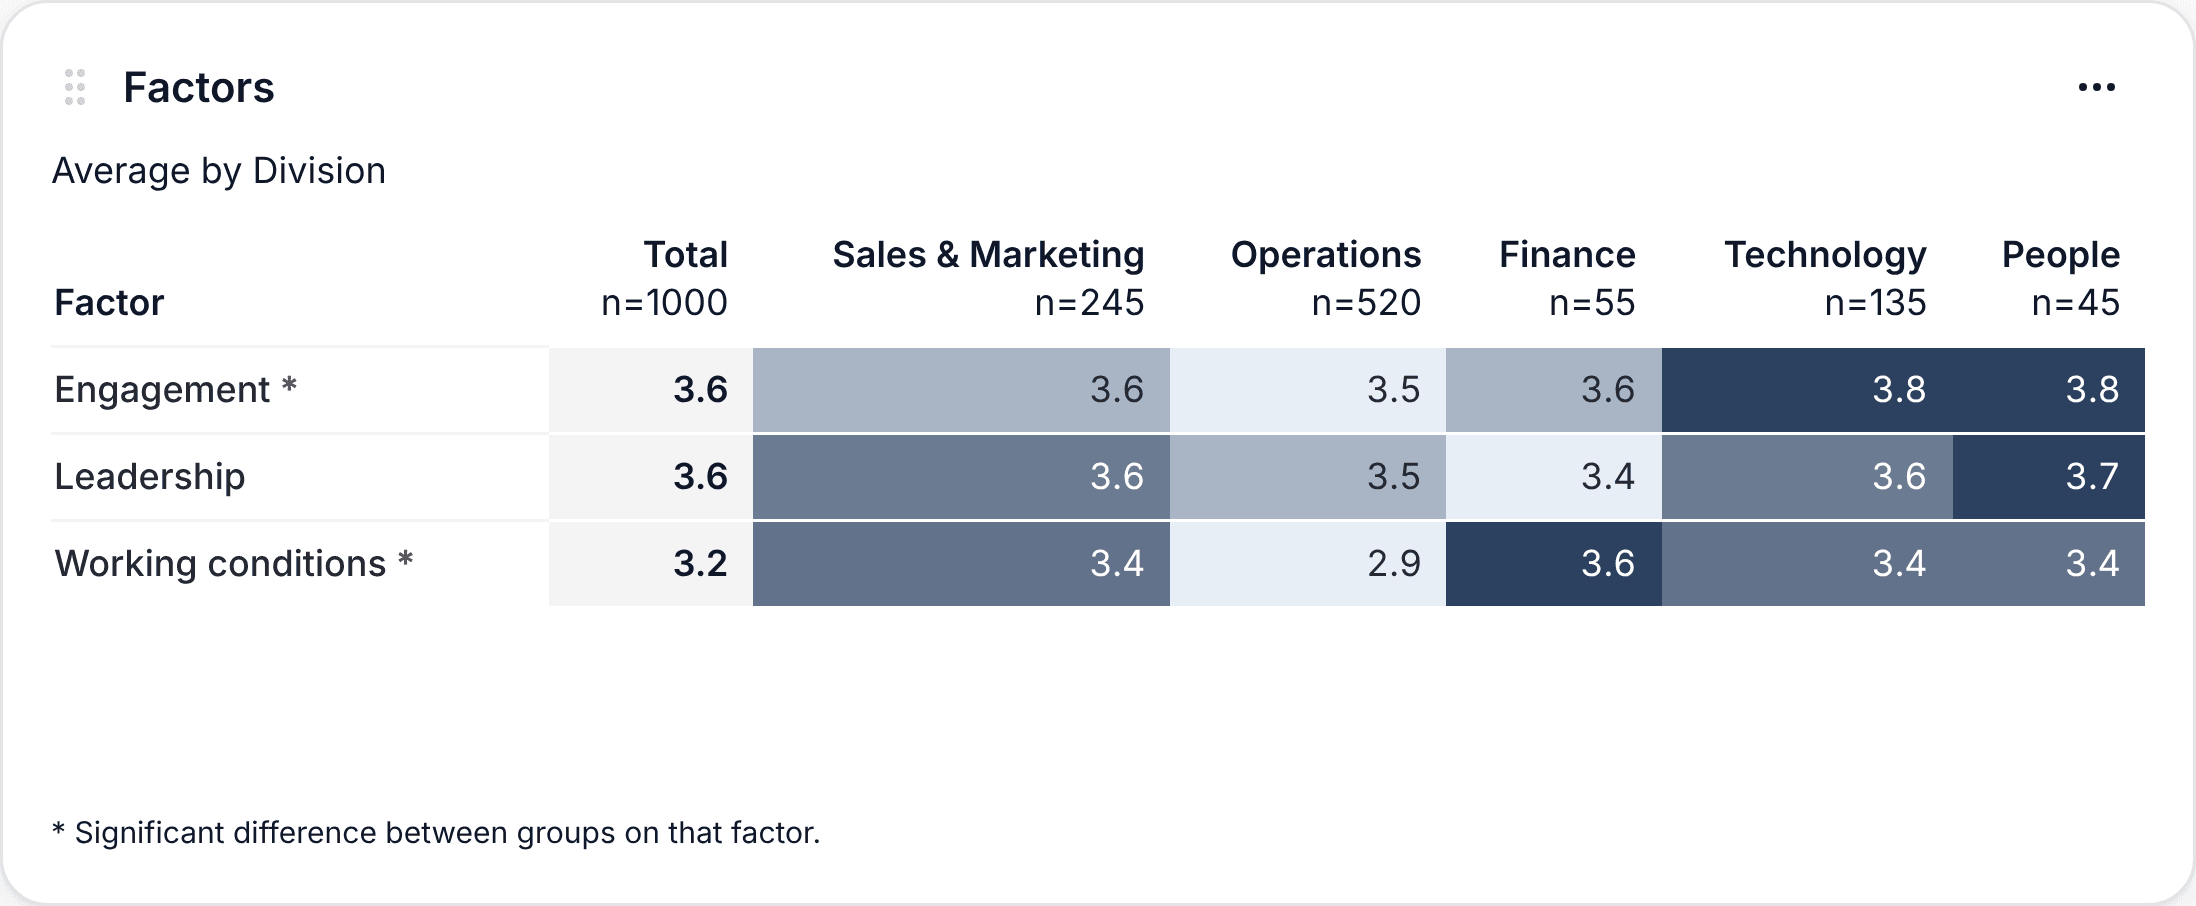
Let's read a real table from the SurvIQ demo: an engagement survey of 1,000 people across 5 divisions.
1. Read each row on its own
The shading compares divisions within the same factor: the lowest is light and the highest is dark. It does not compare factors with each other. Working conditions at 3.2 and Engagement at 3.6 may just mean the working conditions questions are tougher, not that people are worse off on that.
The right question is "which division is lowest on Working conditions?", and here the answer jumps out: Operations, at 2.9 against a Total of 3.2.
2. Compare with the Total, not with the scale
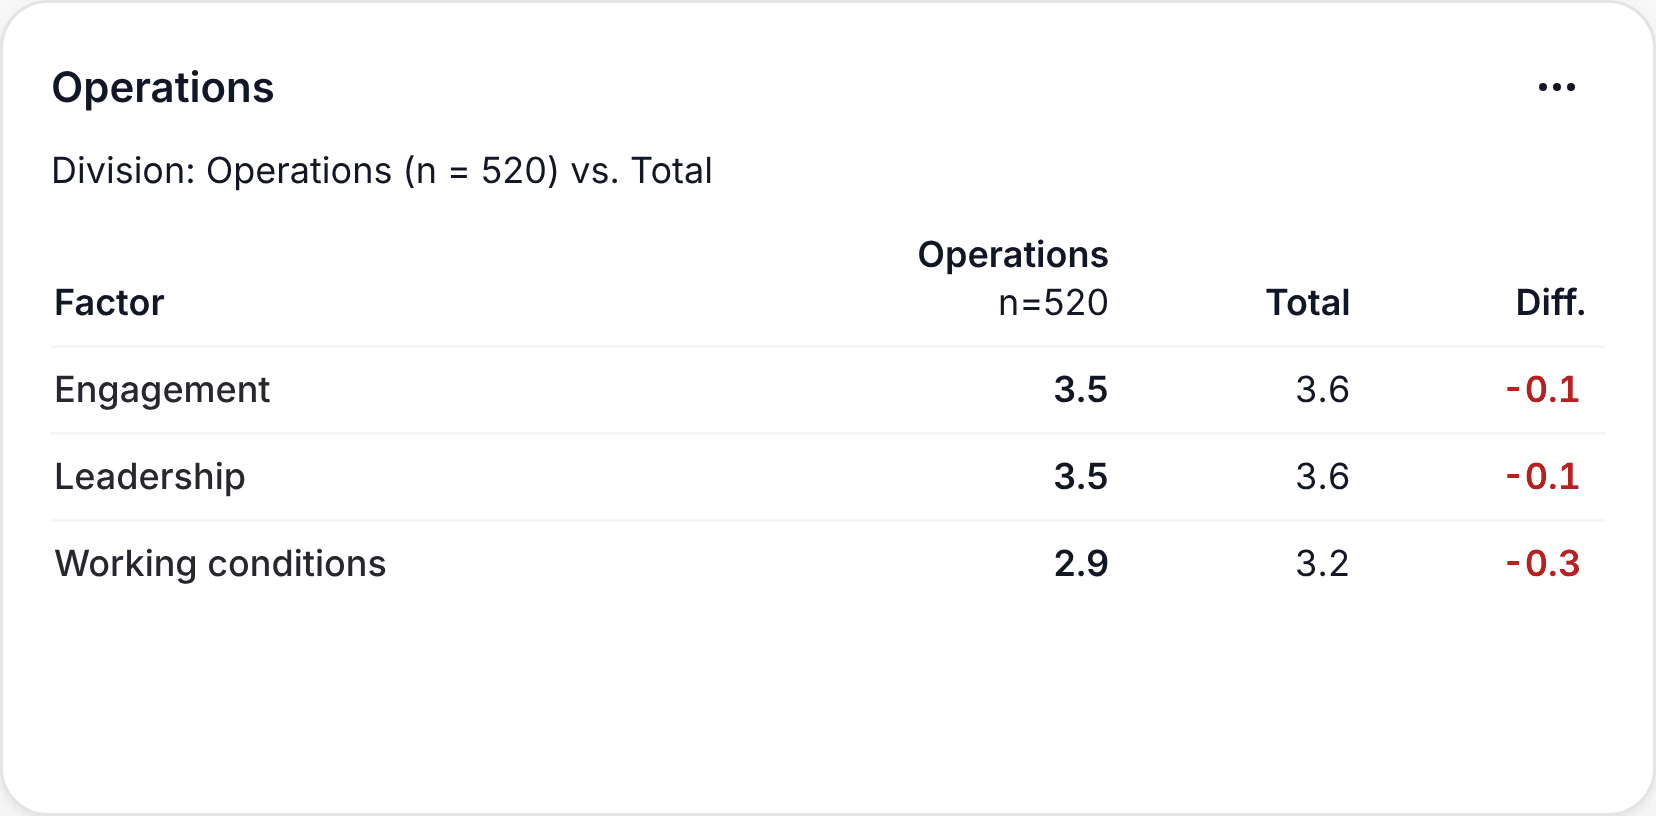
A 3.5 out of 5 looks like a "pass", but if the Total is 3.8, that group is below the rest of the company. That is why the Total comes first in the table. In the per-group layout, the Difference column makes it explicit, with negative differences in red.
3. Check the asterisk before drawing conclusions
The asterisk next to a factor's name means the differences between divisions are significant: they are unlikely to be chance. In the demo, Engagement and Working conditions have one. Leadership does not.
That changes the reading. Finance has the lowest Leadership (3.4), and the temptation is to say "Finance has a problem with its managers". But without an asterisk, that 0.2-point gap may be noise. It is not something to ignore, it is something not to present as a finding.
4. Check each group's size
Under each division is its n. People has 45 responses and Operations 520. An average of 45 people moves more than one of 520, and one of 8 moves with a single person. That is why SurvIQ hides groups with fewer than 5 responses by default, which also protects anonymity.
5. Go from the factor to the questions
The table tells you where to look, not what is happening. If Operations is low on Working conditions, the next step is seeing which of that factor's questions pull it down: is it tools or workload? With Charts by segment you get those questions by division and see it right away. In the demo, it is both.
To go from the factor to the questions:
How to get survey charts by department and divisionCommon mistakes
- Sorting divisions from best to worst and presenting a ranking. It creates defensiveness instead of conversations.
- Comparing factors with each other ("we are worse on Conditions than on Engagement") without an external benchmark.
- Celebrating or panicking over 0.1 differences without an asterisk.
- Showing groups of 3 or 4 people in a confidential survey.
- Stopping at the table without looking at that group's questions and open comments.
What to do with what you find
- Pick one or two factors with an asterisk where a division is clearly below. No more.
- Share with each manager their table against the Total. In SurvIQ, "One file per group" builds a PowerPoint per division.
- Ask each team to read their results and propose one or two concrete actions.
- Run the survey again in 6 months with the same factors to see if it moved.
How to create the factors and build the table, step by step:
See the Factor table tutorial