How to analyze Google Forms responses beyond the summary
 By Enzo CaminoPsychologist and founder of SurvIQ
Google Forms is the fastest way to collect responses, so it gets used for everything: class surveys, customer surveys, employee surveys. The Responses tab has a summary with one chart per question. To know how many people picked each option, that is enough.
The trouble comes with the second question anyone asks about the results: what about each department? what about people with more than a year? what is the average satisfaction? is the gap between men and women real? The summary answers none of that.
What the Google Forms summary gives you
- A pie or bar chart per question, with the count and percentage.
- The list of text answers, one under the other.
- The Individual view, to see what each person answered.
- No filters by group, no averages by department and no comparisons between groups.
Analyzing it in Google Sheets
The usual step is to link the form to a spreadsheet and use pivot tables. It works, but every analysis is manual work:
- Turn text scales into numbers with a helper column (for example "Very satisfied" = 5) so you can average them.
- Split the checkboxes: Google stores them all in one cell, separated by commas.
- Build a pivot table for each cross: question by department, question by gender, question by tenure.
- Build the charts one by one, and rebuild them when new responses come in.
If you do it in Sheets, keep the original responses on their own sheet and work on a copy. A filter or sort applied wrongly on the linked sheet scrambles everything.
If you just want percentages, NPS and results by department with no account, upload your CSV here:
Analyze Google Forms responses freeImport the CSV and analyze it all at once
The other option is to download the responses (Responses > Download responses, as .csv) and import them into SurvIQ. SurvIQ builds the survey with the form's questions, splits the checkboxes, orders the scales and loads every response with its date.
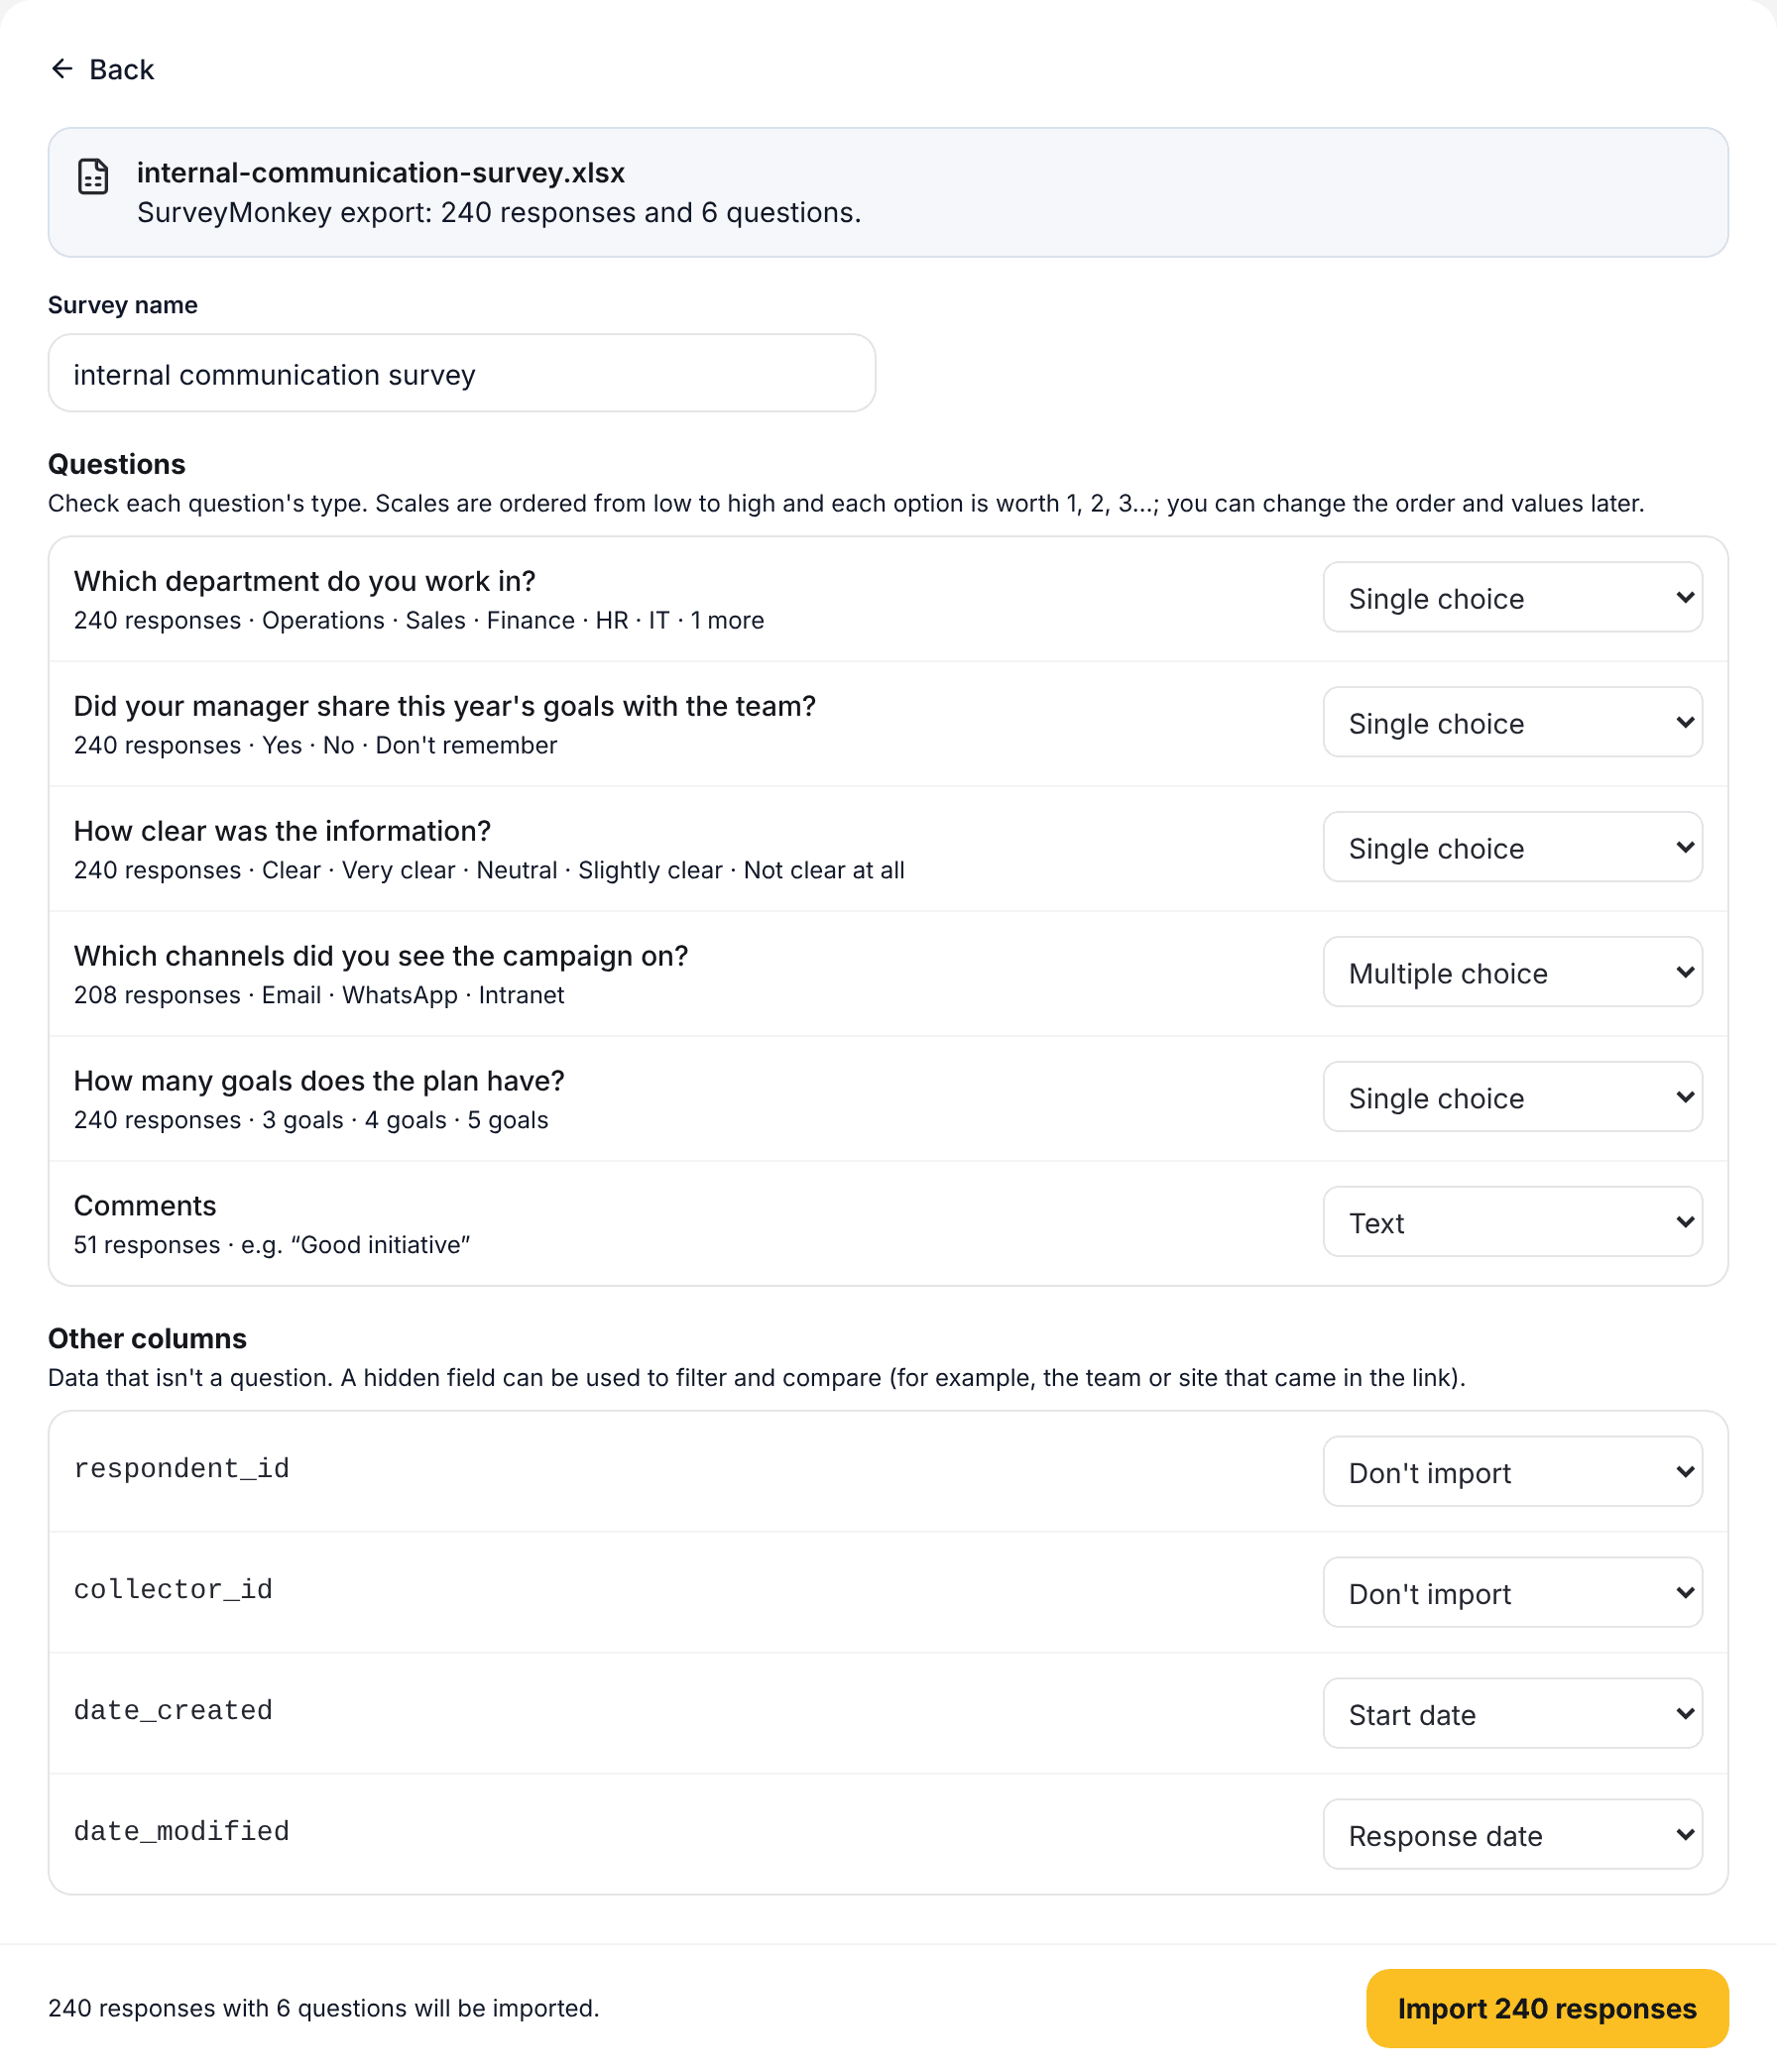
With the responses loaded you get:
- Filters by any question: only one department, one class or a date range.
- Compare by: each question split by group, with each group's average or percentage.
- Charts by segment: every chart by department at once, with an overall summary on top.
- Open comments grouped by theme with AI.
- Export to Excel with a sheet per question, to SPSS or to PowerPoint.
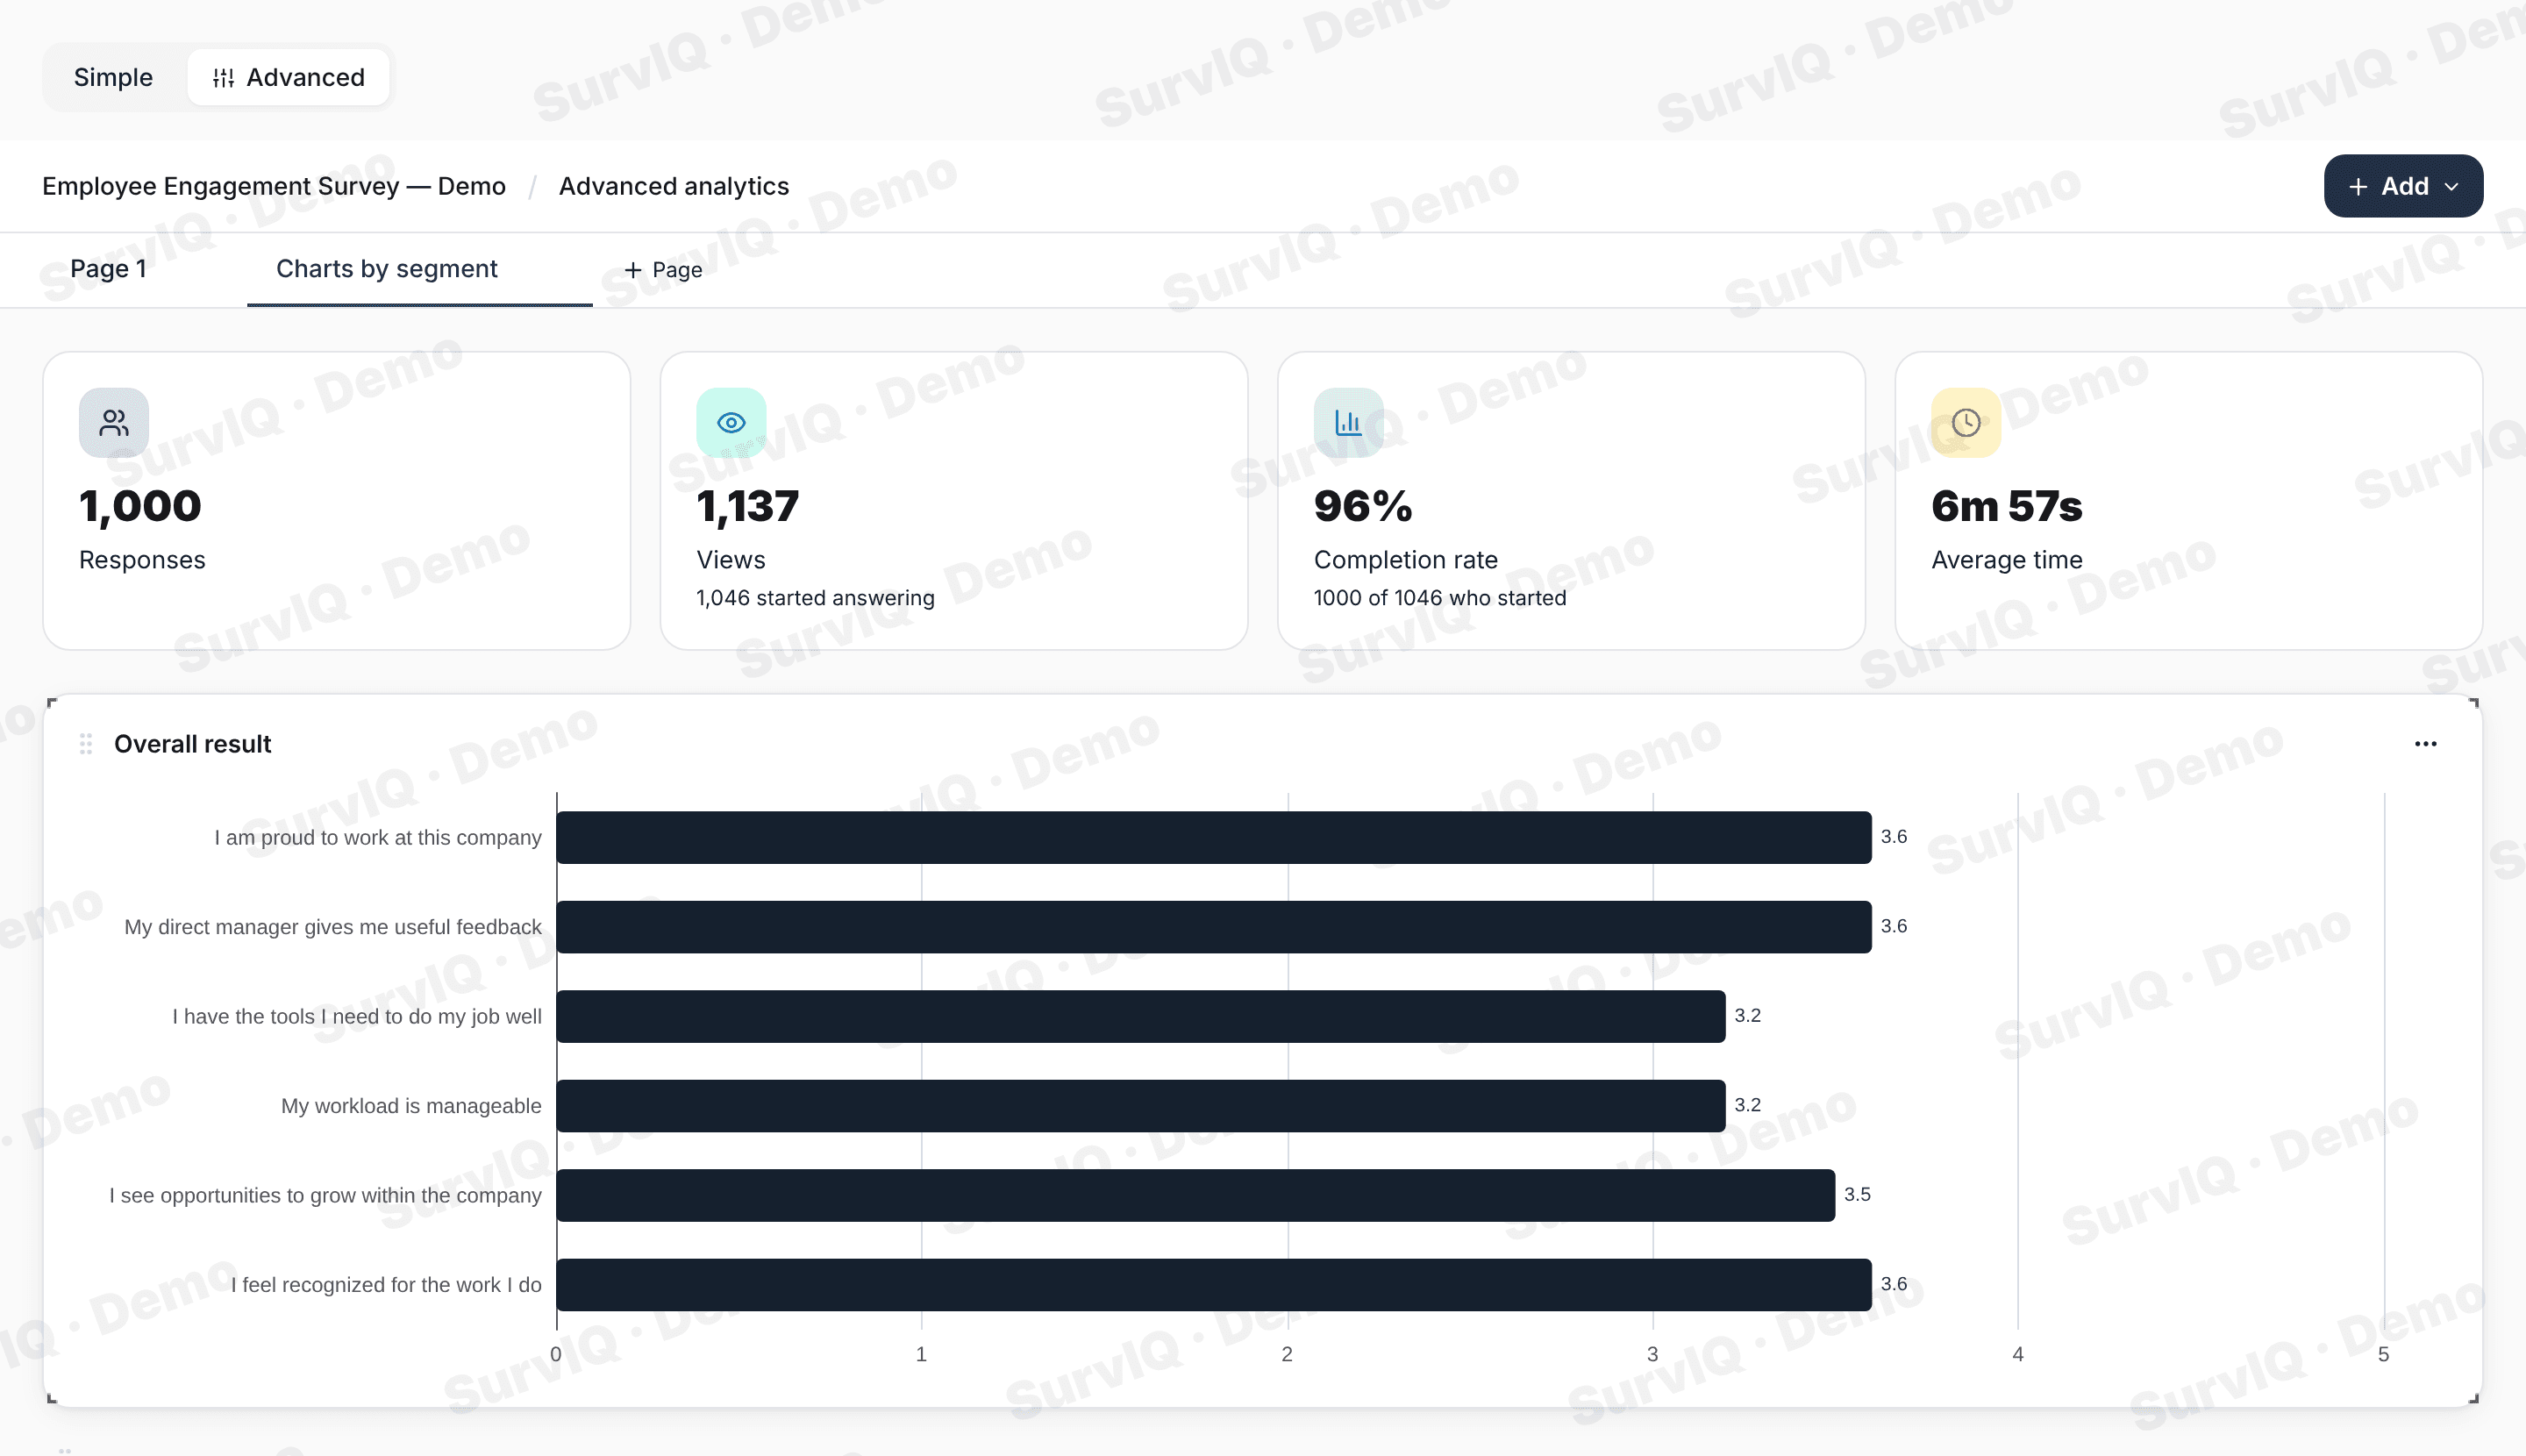
Before you draw conclusions
- Check how many responses each group has. 80% of 5 people doesn't weigh the same as 80% of 200.
- A difference between groups can be chance. Check whether it is significant before presenting it as a finding.
- If the form stayed open, filter by date so you don't mix responses from two different moments.
The tutorial with screenshots:
Import responses, step by step