How to analyze a SurveyMonkey export without spending days in Excel
 By Enzo CaminoPsychologist and founder of SurvIQ
Many company surveys run on SurveyMonkey or Google Forms and get analyzed in Excel. Running the survey usually goes fine. The trouble starts with the exported file: two header rows, one column per option on multiple-choice questions, scales as text ("Strongly agree") and empty IP, email and name columns.
Before a single chart you have to clean all of that: merge the headers, turn the scales into numbers in the right order, combine the columns of each multiple-choice question. Then come the pivot tables, one per question and department. With 25 questions and 10 departments, that is days of work.
What the SurveyMonkey file contains
- Two header rows: the question on top and the option or "Response" below. Multiple-choice questions and matrices take several columns under one header.
- Respondent data columns: Respondent ID, start and end dates, IP, email, name and custom fields. Almost always empty except the dates.
- Scales as text. To average them you have to decide what each option is worth and in which order they go.
- Blank answers that need to be told apart from "Don't know".
Export "All individual responses" with the actual answer text, not the numeric columns, so you don't have to remember which number was which option.
Import the file instead of cleaning it
In SurvIQ, New survey has an Import responses option. Upload the Excel or CSV file and SurvIQ recognizes SurveyMonkey's two header rows, builds each question with its options and leaves out the empty columns. Known scales (agree, satisfied, excellent, likely) are ordered from low to high and each option is worth 1, 2, 3…
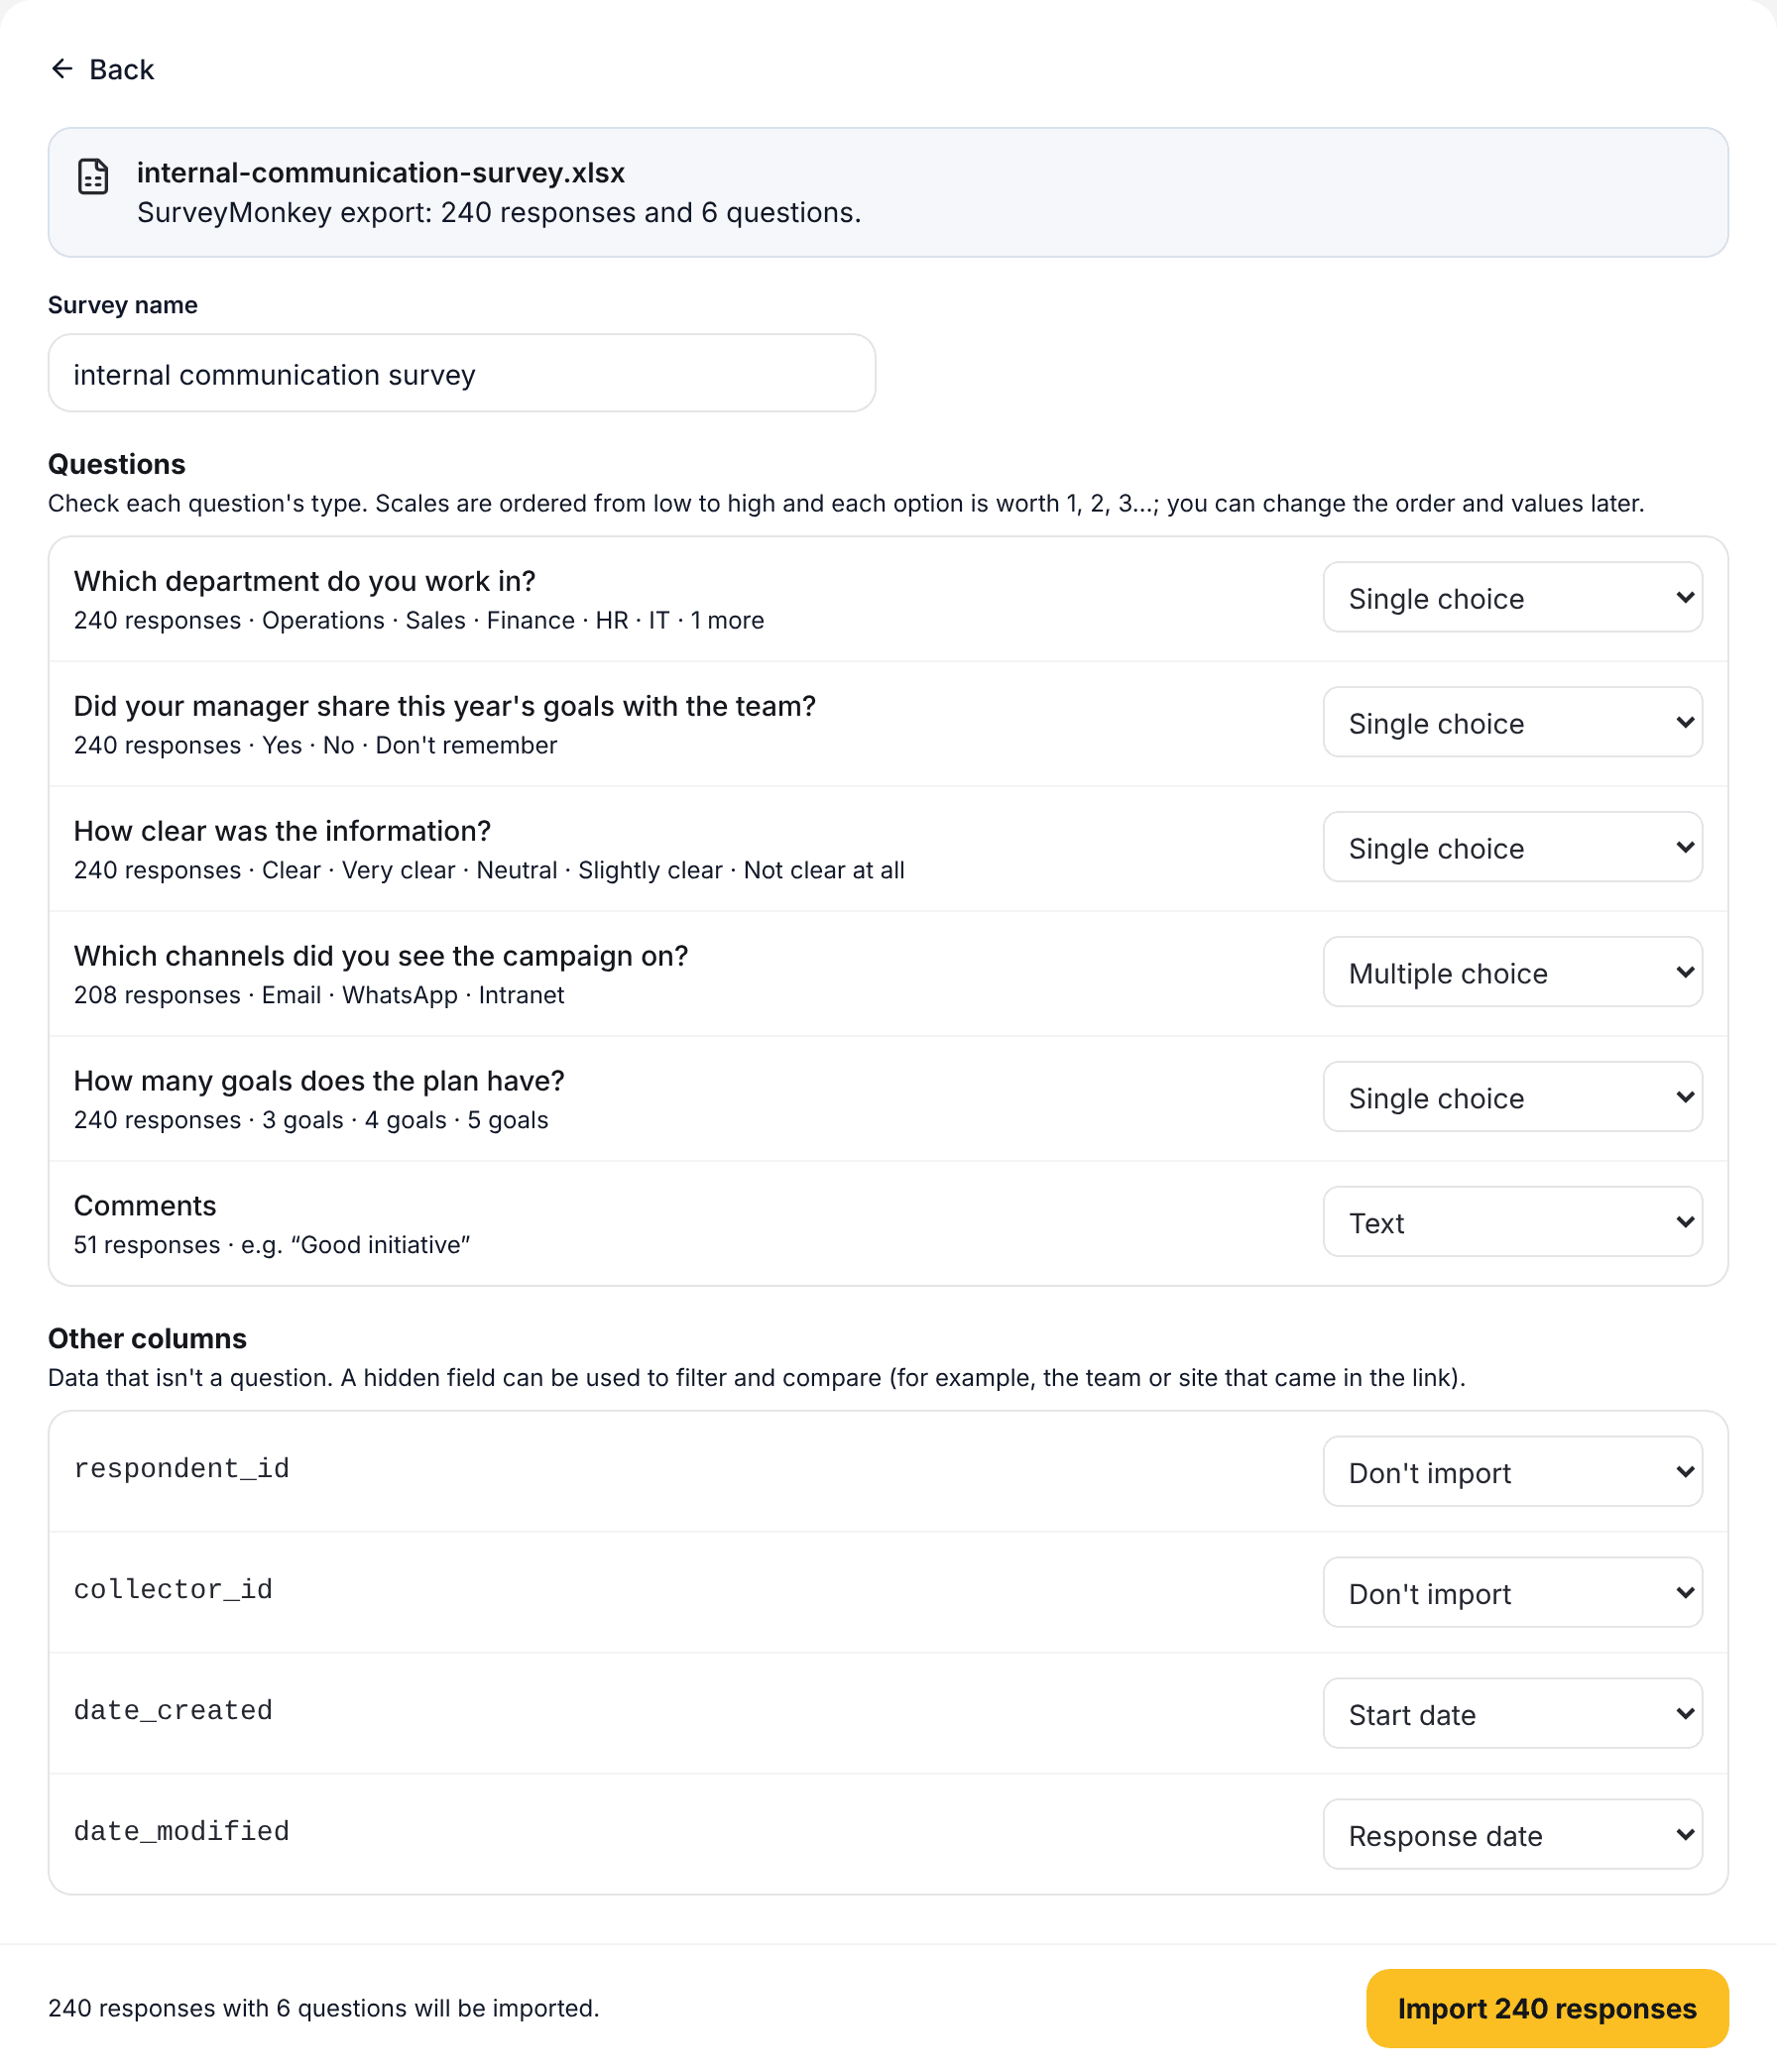
Before importing you can change the type of any column or leave it out. Columns that aren't questions, like the office that came in the link, can be kept as a hidden field to filter and compare. Imported responses don't use your plan's monthly quota.
From the file to charts by department
Once the responses are in, what used to be pivot tables takes a few clicks:
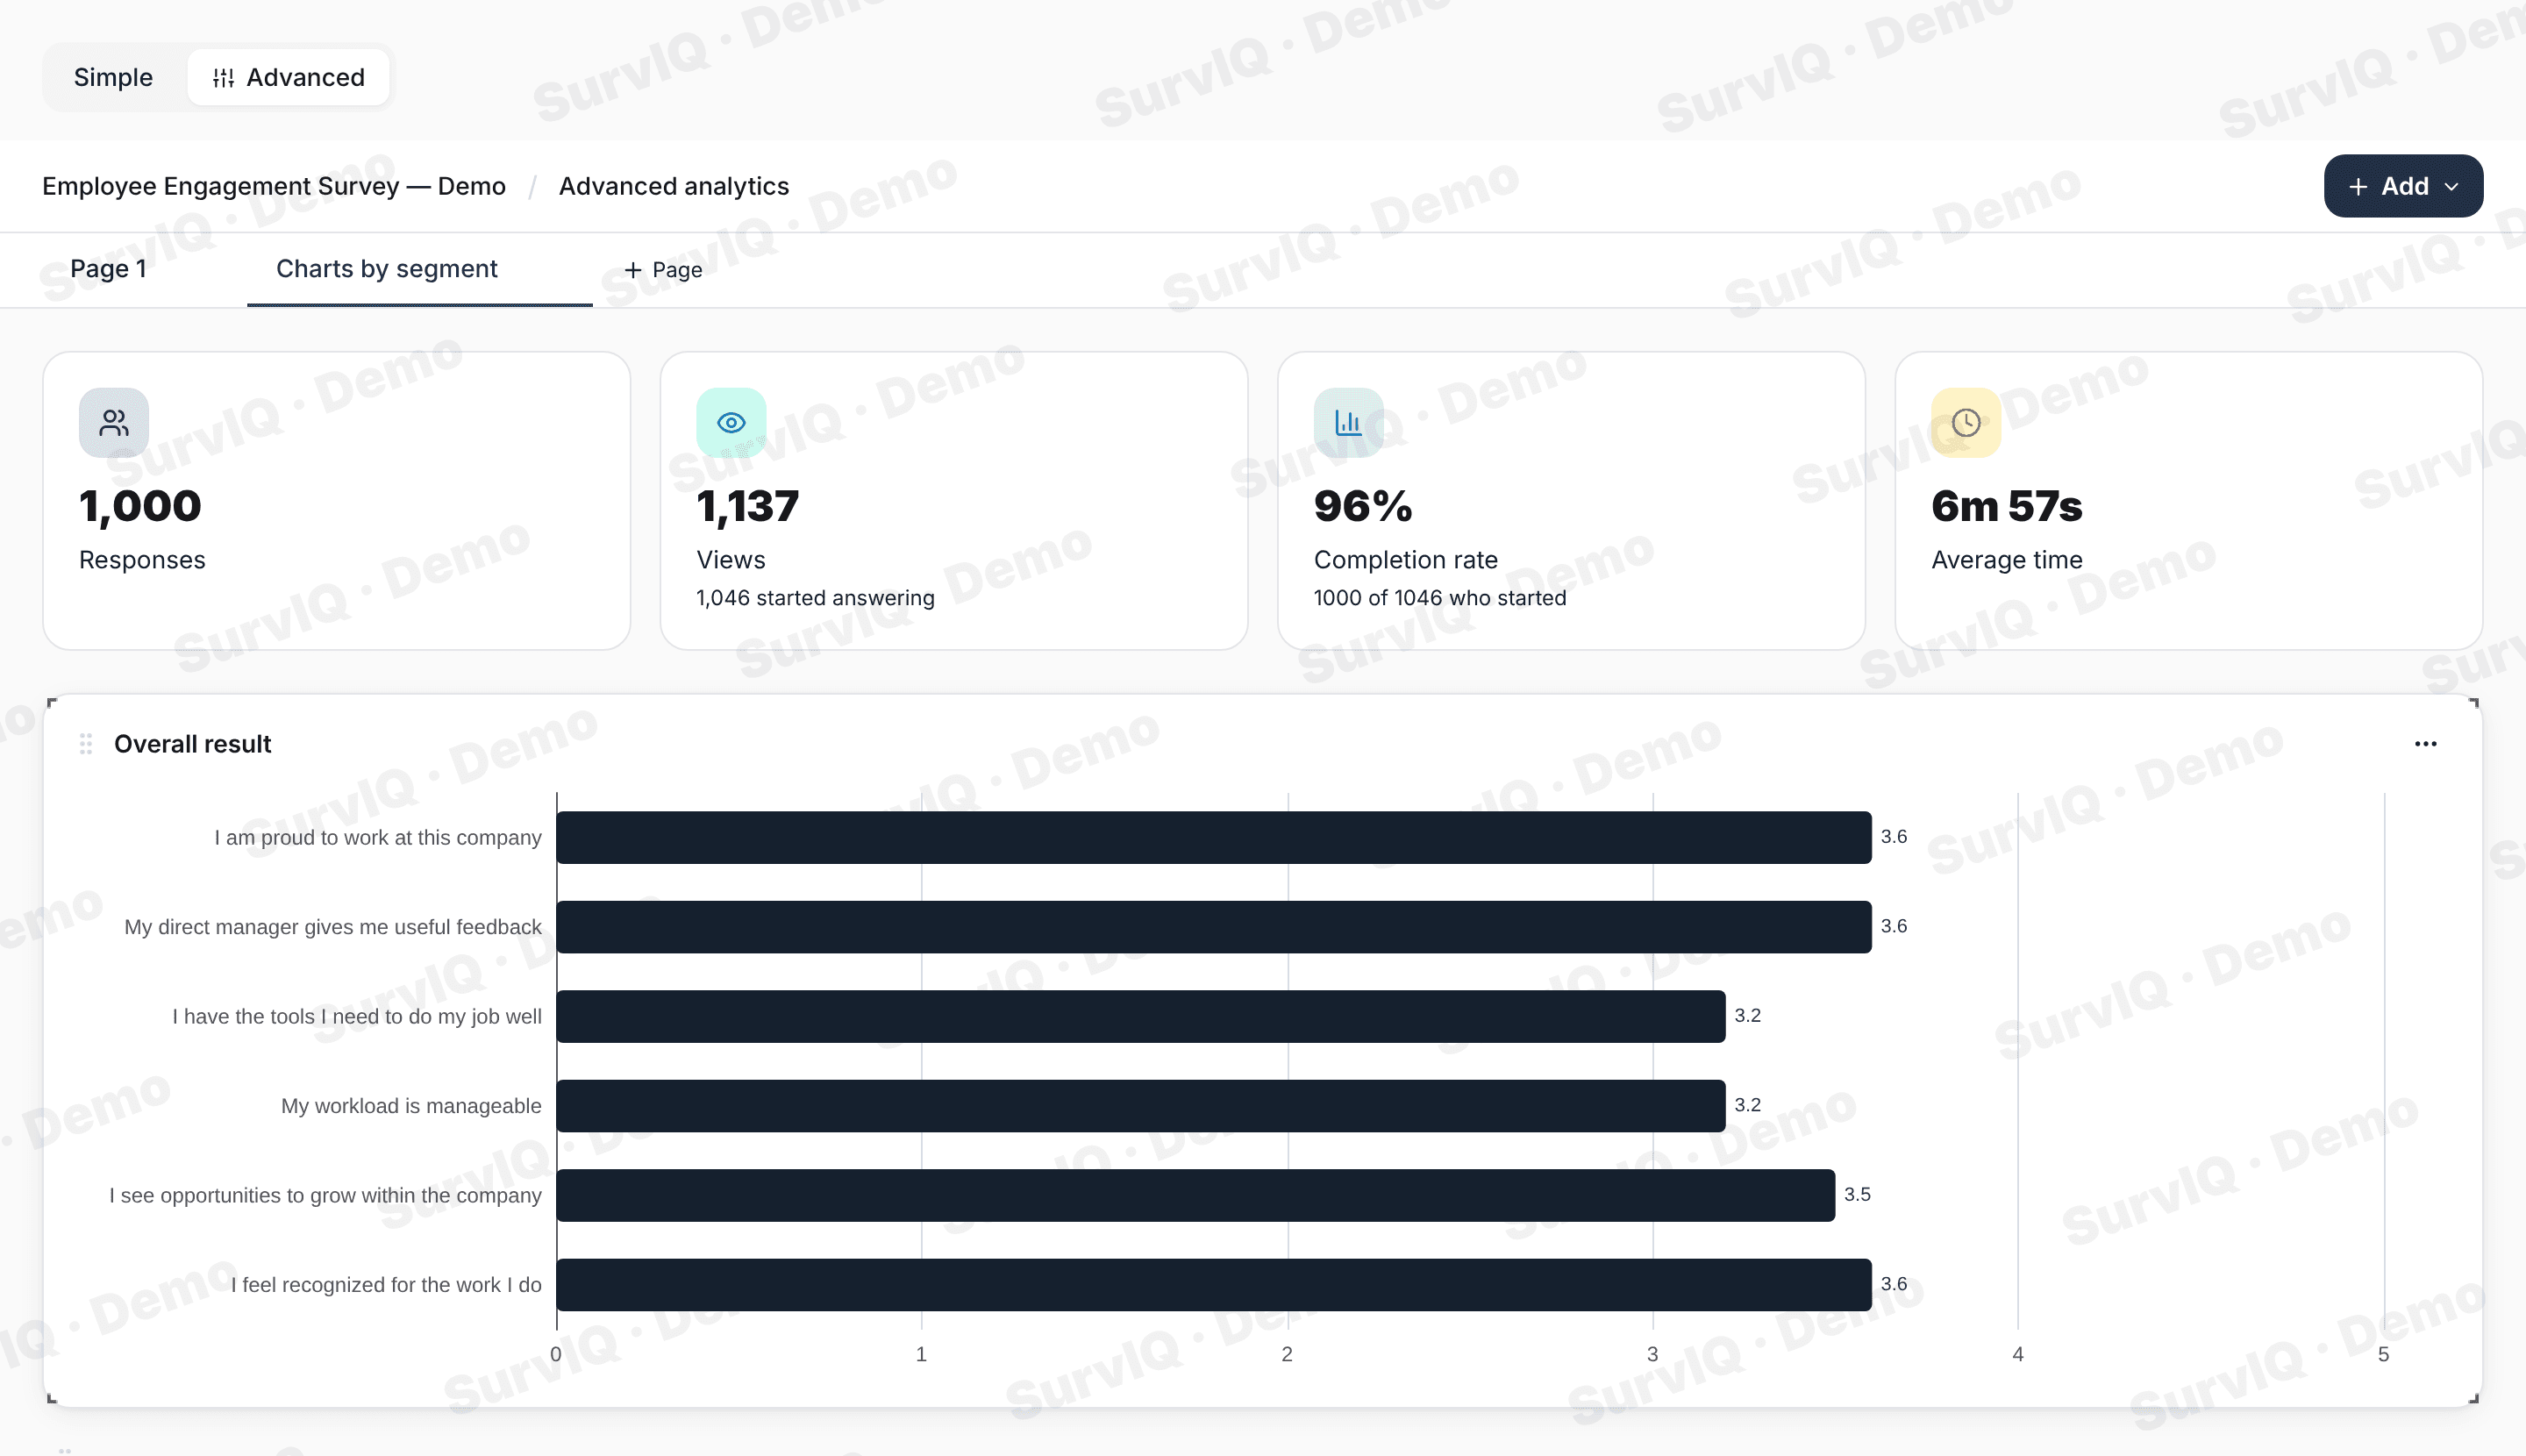
- Charts by segment: every chart in the survey by department, division or region at once, with the Total next to each and groups under 5 people combined into "Other".
- Overall summary: one chart with the average of each question side by side, sorted from highest to lowest.
- Factors: the average of several questions per person (Leadership, Communication, Conditions) and a factor table by department.
- Export: the whole page to PowerPoint or PDF, or one file per department.
What to check before you present
- That scales are in the right order. If a question uses an unusual scale, order it by hand in the review step.
- "Don't know" options: they shouldn't count in the average. In the editor, under Value per option, leave them without a value and they are left out.
- Small groups: a 3-person department shouldn't show up on its own in a confidential survey.
- Negatively worded questions, if you are going to build factors.
The full tutorial with screenshots:
Import responses, step by step