Performance review errors and biases (and how to avoid them)
 By Enzo CaminoPsychologist and founder of SurvIQ
No manager wakes up wanting to review their team badly. Still, when you put the whole company’s scores together, odd patterns appear: an area where everyone gets a 5, a manager who never goes above 3, a person who dropped sharply because of one mistake in November. It is almost always a bias, not bad intent.
| Bias | What happens | How to avoid it |
|---|---|---|
| Halo effect | One great trait lifts the whole score | Rate each competency with its own example |
| Leniency | Everyone gets a 4 or 5 | Calibrate across managers with the distribution in view |
| Central tendency | Everyone gets a 3 | A scale with a sentence describing each number |
| Recency | Only the last month counts | Mid-year check-in and notes during the year |
| Similarity | Higher scores for people like the manager | Measurable goals and a second look by the manager’s manager |
Nobody is free of bias. What works is designing the process so biases show up and get corrected.
Halo effect (and its opposite)
One very good, or very bad, trait spills into every other score. Someone who sells a lot ends up with a 5 in teamwork even though they share nothing. To avoid it, rate each competency with its own example: “what did they do this year that shows teamwork?”. No example, no high score.
Leniency and severity
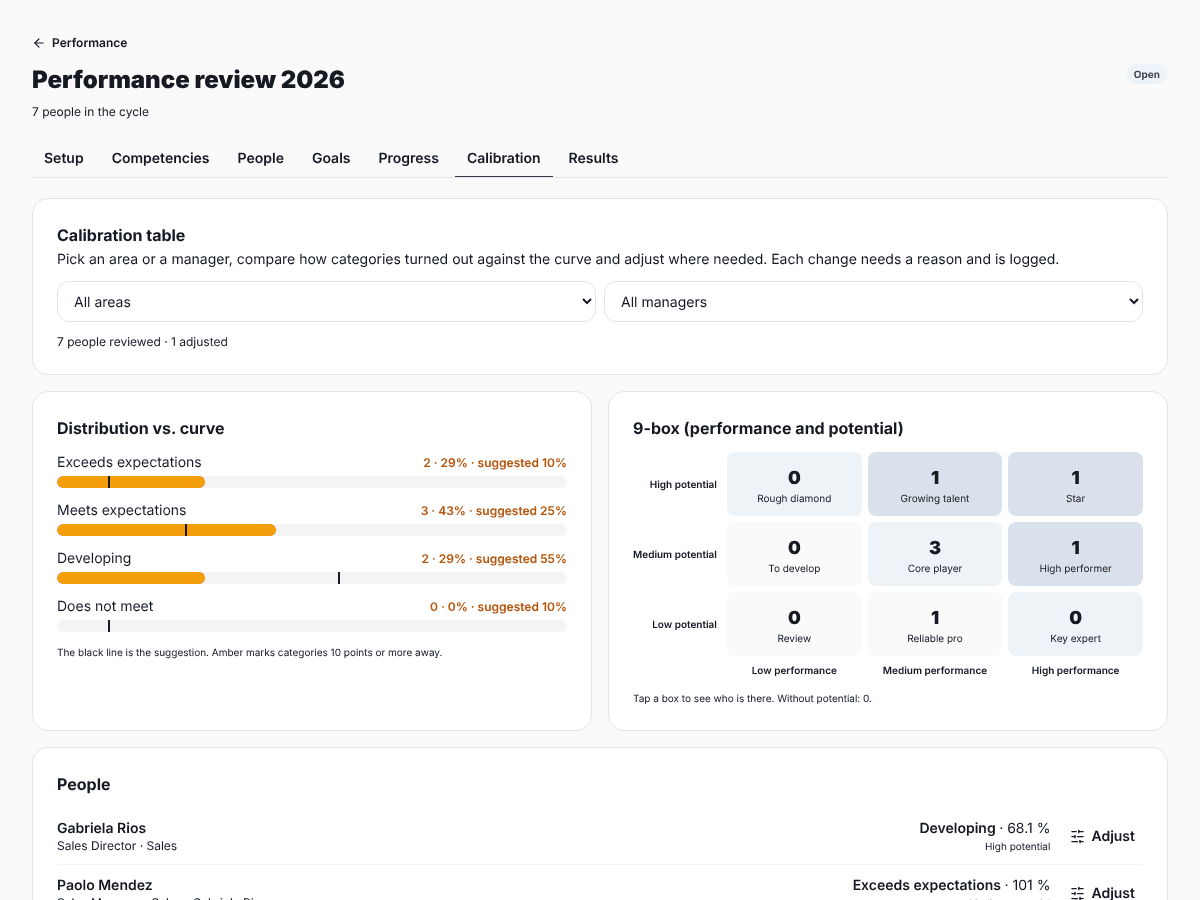
Some managers give everyone a 4 or 5 to avoid hard conversations; others never go above 3 because “nobody is perfect”. Both hurt people: some get a score that tells them nothing and others land below colleagues in another area doing the same work. The tool for this is calibration: looking at every manager’s scores together before delivering them.
Central tendency
Everyone gets a 3. It is the safe choice: nothing to justify. It happens mostly when the scale does not explain what each number means. If 3 says “Meets expectations: does the job well without needing help” and 4 says “Exceeds expectations: also improves how it is done”, it is harder for a manager to stay in the middle without thinking.
Recency
Only the last two months are remembered. A great first half disappears behind a bad November, or the other way around. Fix it with a mid-year check-in and a place to log progress during the year, like a goal tracking board, so December does not depend on memory.
Similarity
Without noticing, we rate people like us higher: same way of working, same interests, same school. Measurable goals help (numbers have no favorites), as do the self-review side by side with the manager’s and a second look by the manager’s manager before closing.
Two more worth watching
- Contrast: rating someone against the previous person on the list instead of against what their role expects.
- First impression: a score that sticks from when the person joined, even though they have changed a lot.
What helps most
- Measurable goals from the start of the year.
- A scale with one sentence per number.
- Required concrete examples for high or low competency ratings.
- A mid-year check-in.
- Calibration across managers before scores are delivered.
To see your team’s distribution during calibration:
Free 9-box gridGoals, self-review, manager review, 9-box calibration and sign-off, in a portal where each person signs in without an account.
See SurvIQ Performance Review