Employee survey participation rate: how to calculate it by department and what its margin of error is
 By Enzo CaminoPsychologist and founder of SurvIQ
The first thing anyone asks when they get the results of an engagement survey is how many people responded. The second is whether enough people in their department responded to trust the result. That is why the first slide of a good report is participation: overall and by department.
How it is calculated
A department's participation rate is its responses divided by the people who work there. To calculate it you need something the survey doesn't have: the headcount of each department. It usually comes from HR in a spreadsheet.
- Use the same list of departments as the survey question. If the survey says "Sales Division" and the spreadsheet says "Sales", they won't match.
- Use the headcount from when the survey ran, not today's.
- Decide what to do with people who didn't give their department: they are left out of the department rates but count in the total responses.
The margin of error changes when you know the total
The margin of error formula you see everywhere assumes the population is huge. In a company it isn't: if you know there are 1,210 people and 1,000 responded, there is almost nobody left to survey. With the finite population correction the margin shrinks a lot:
- 1,000 responses without correction: ±3.1% at 95% confidence.
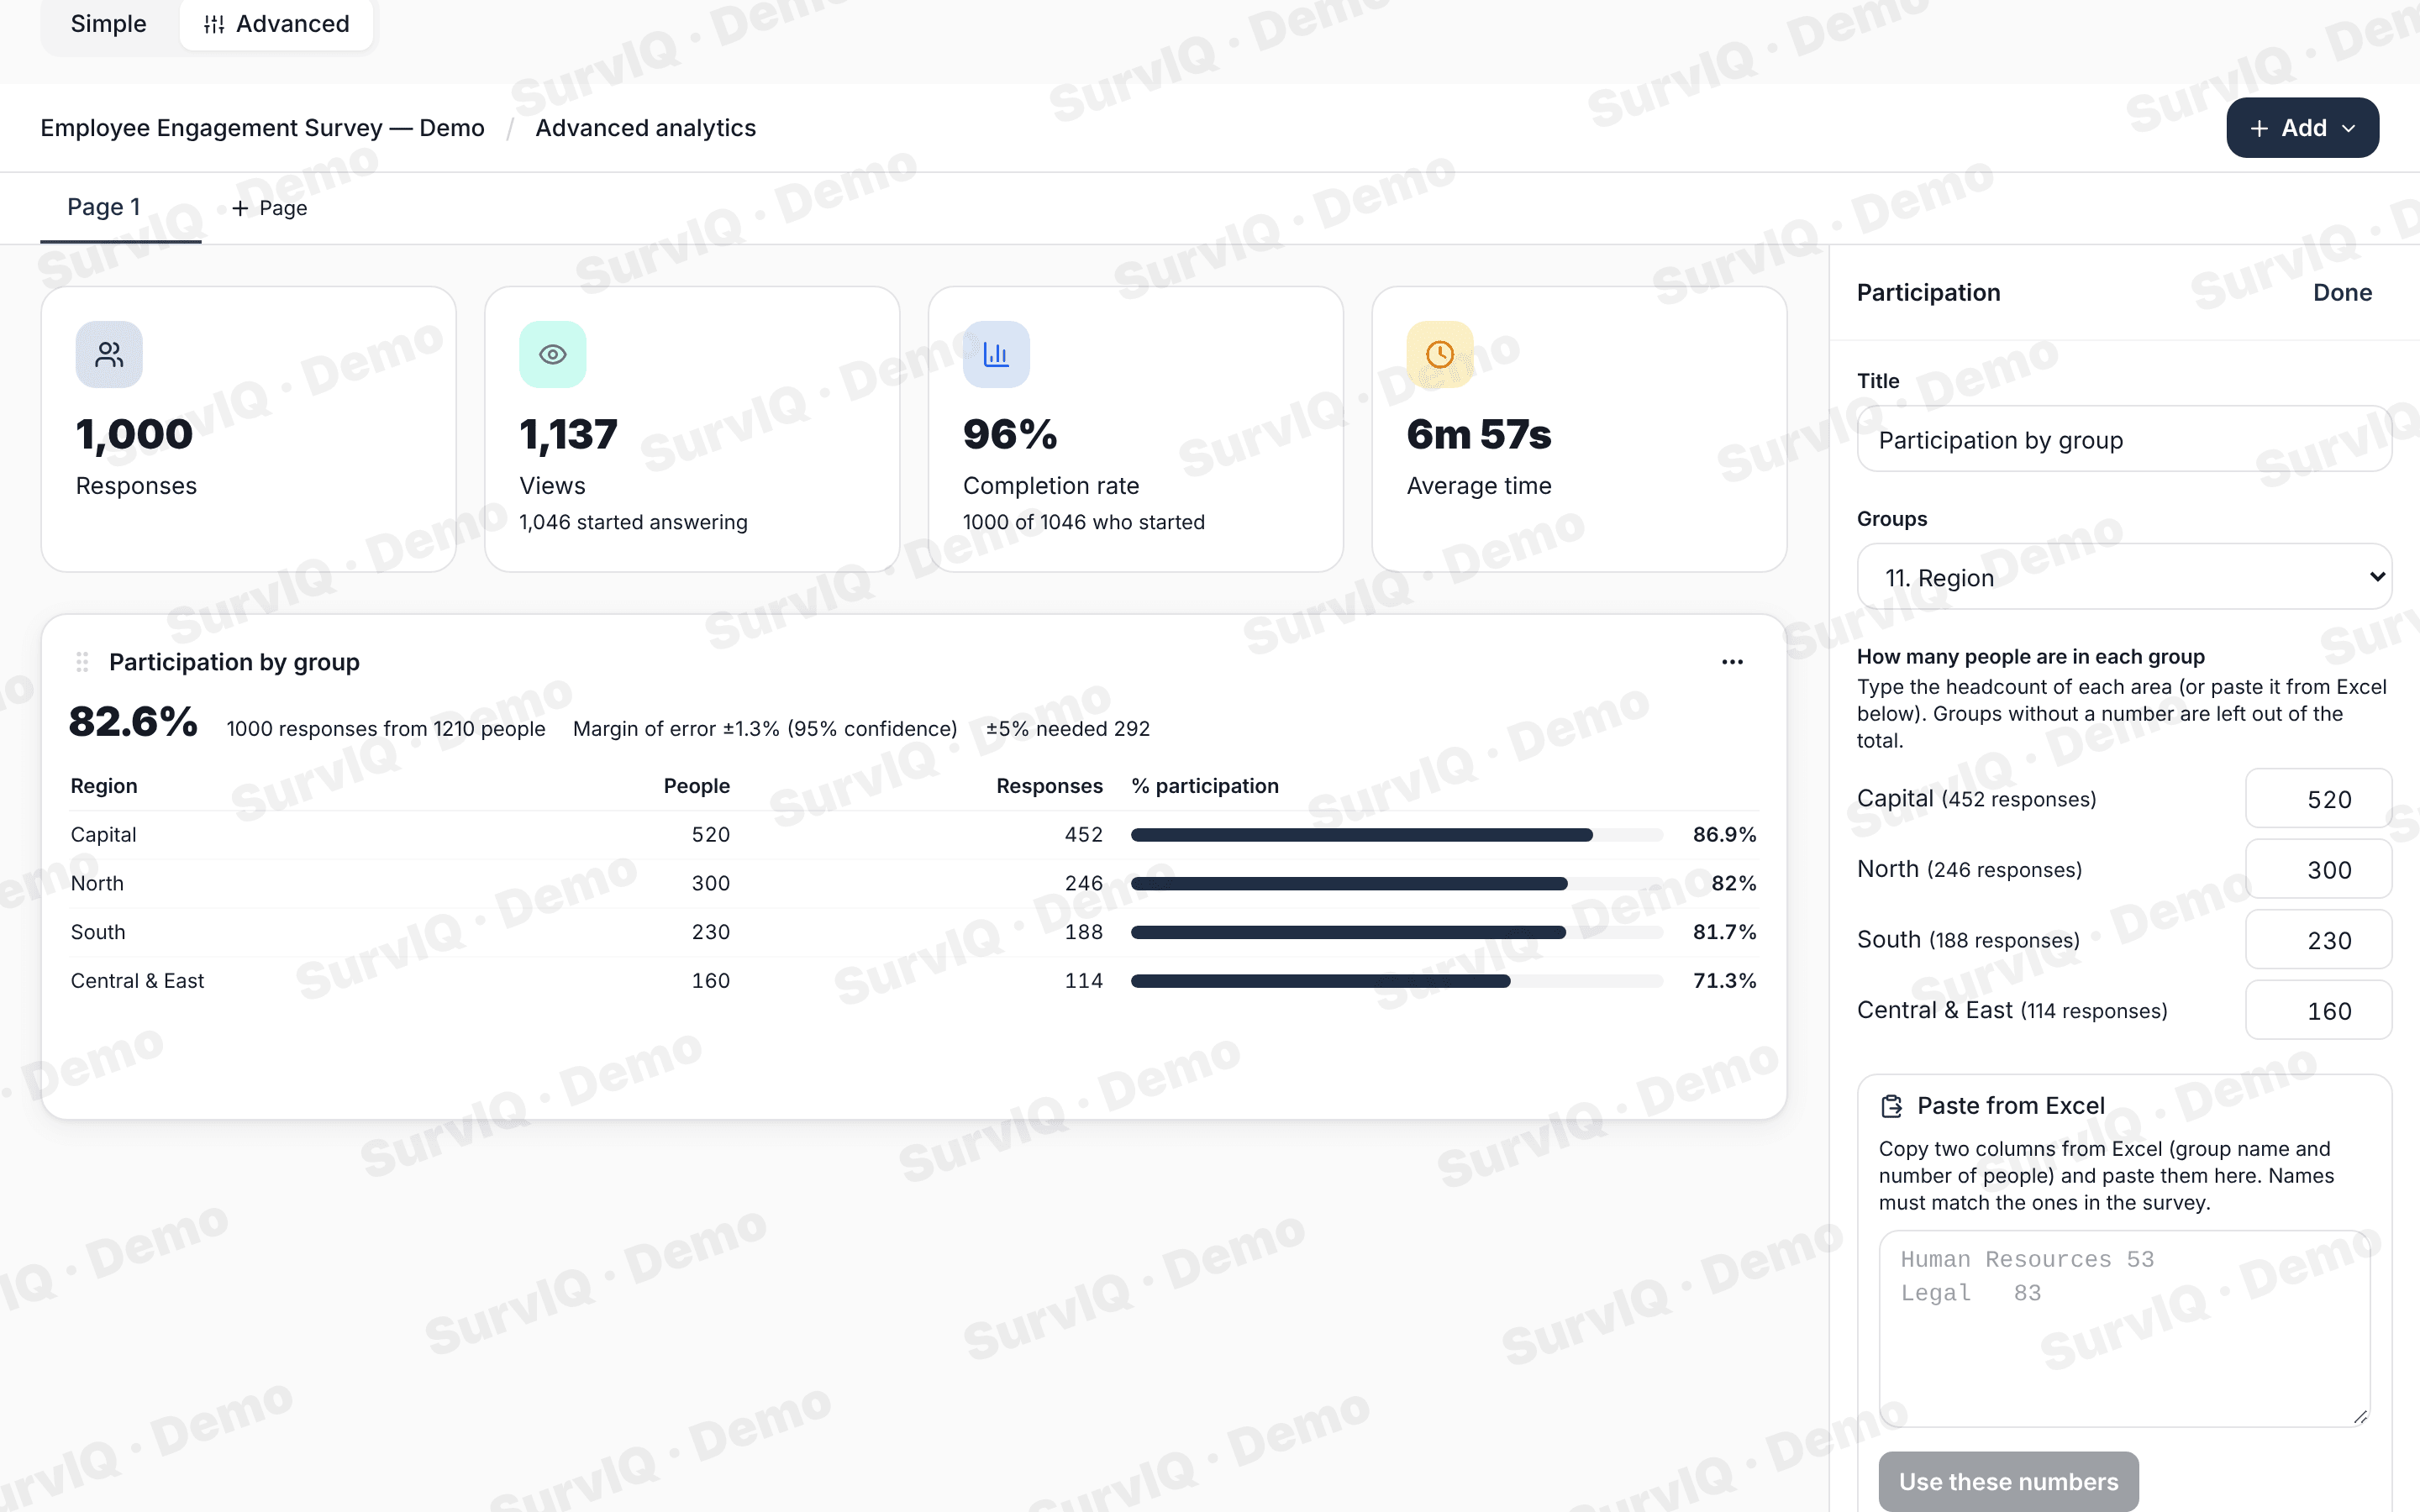
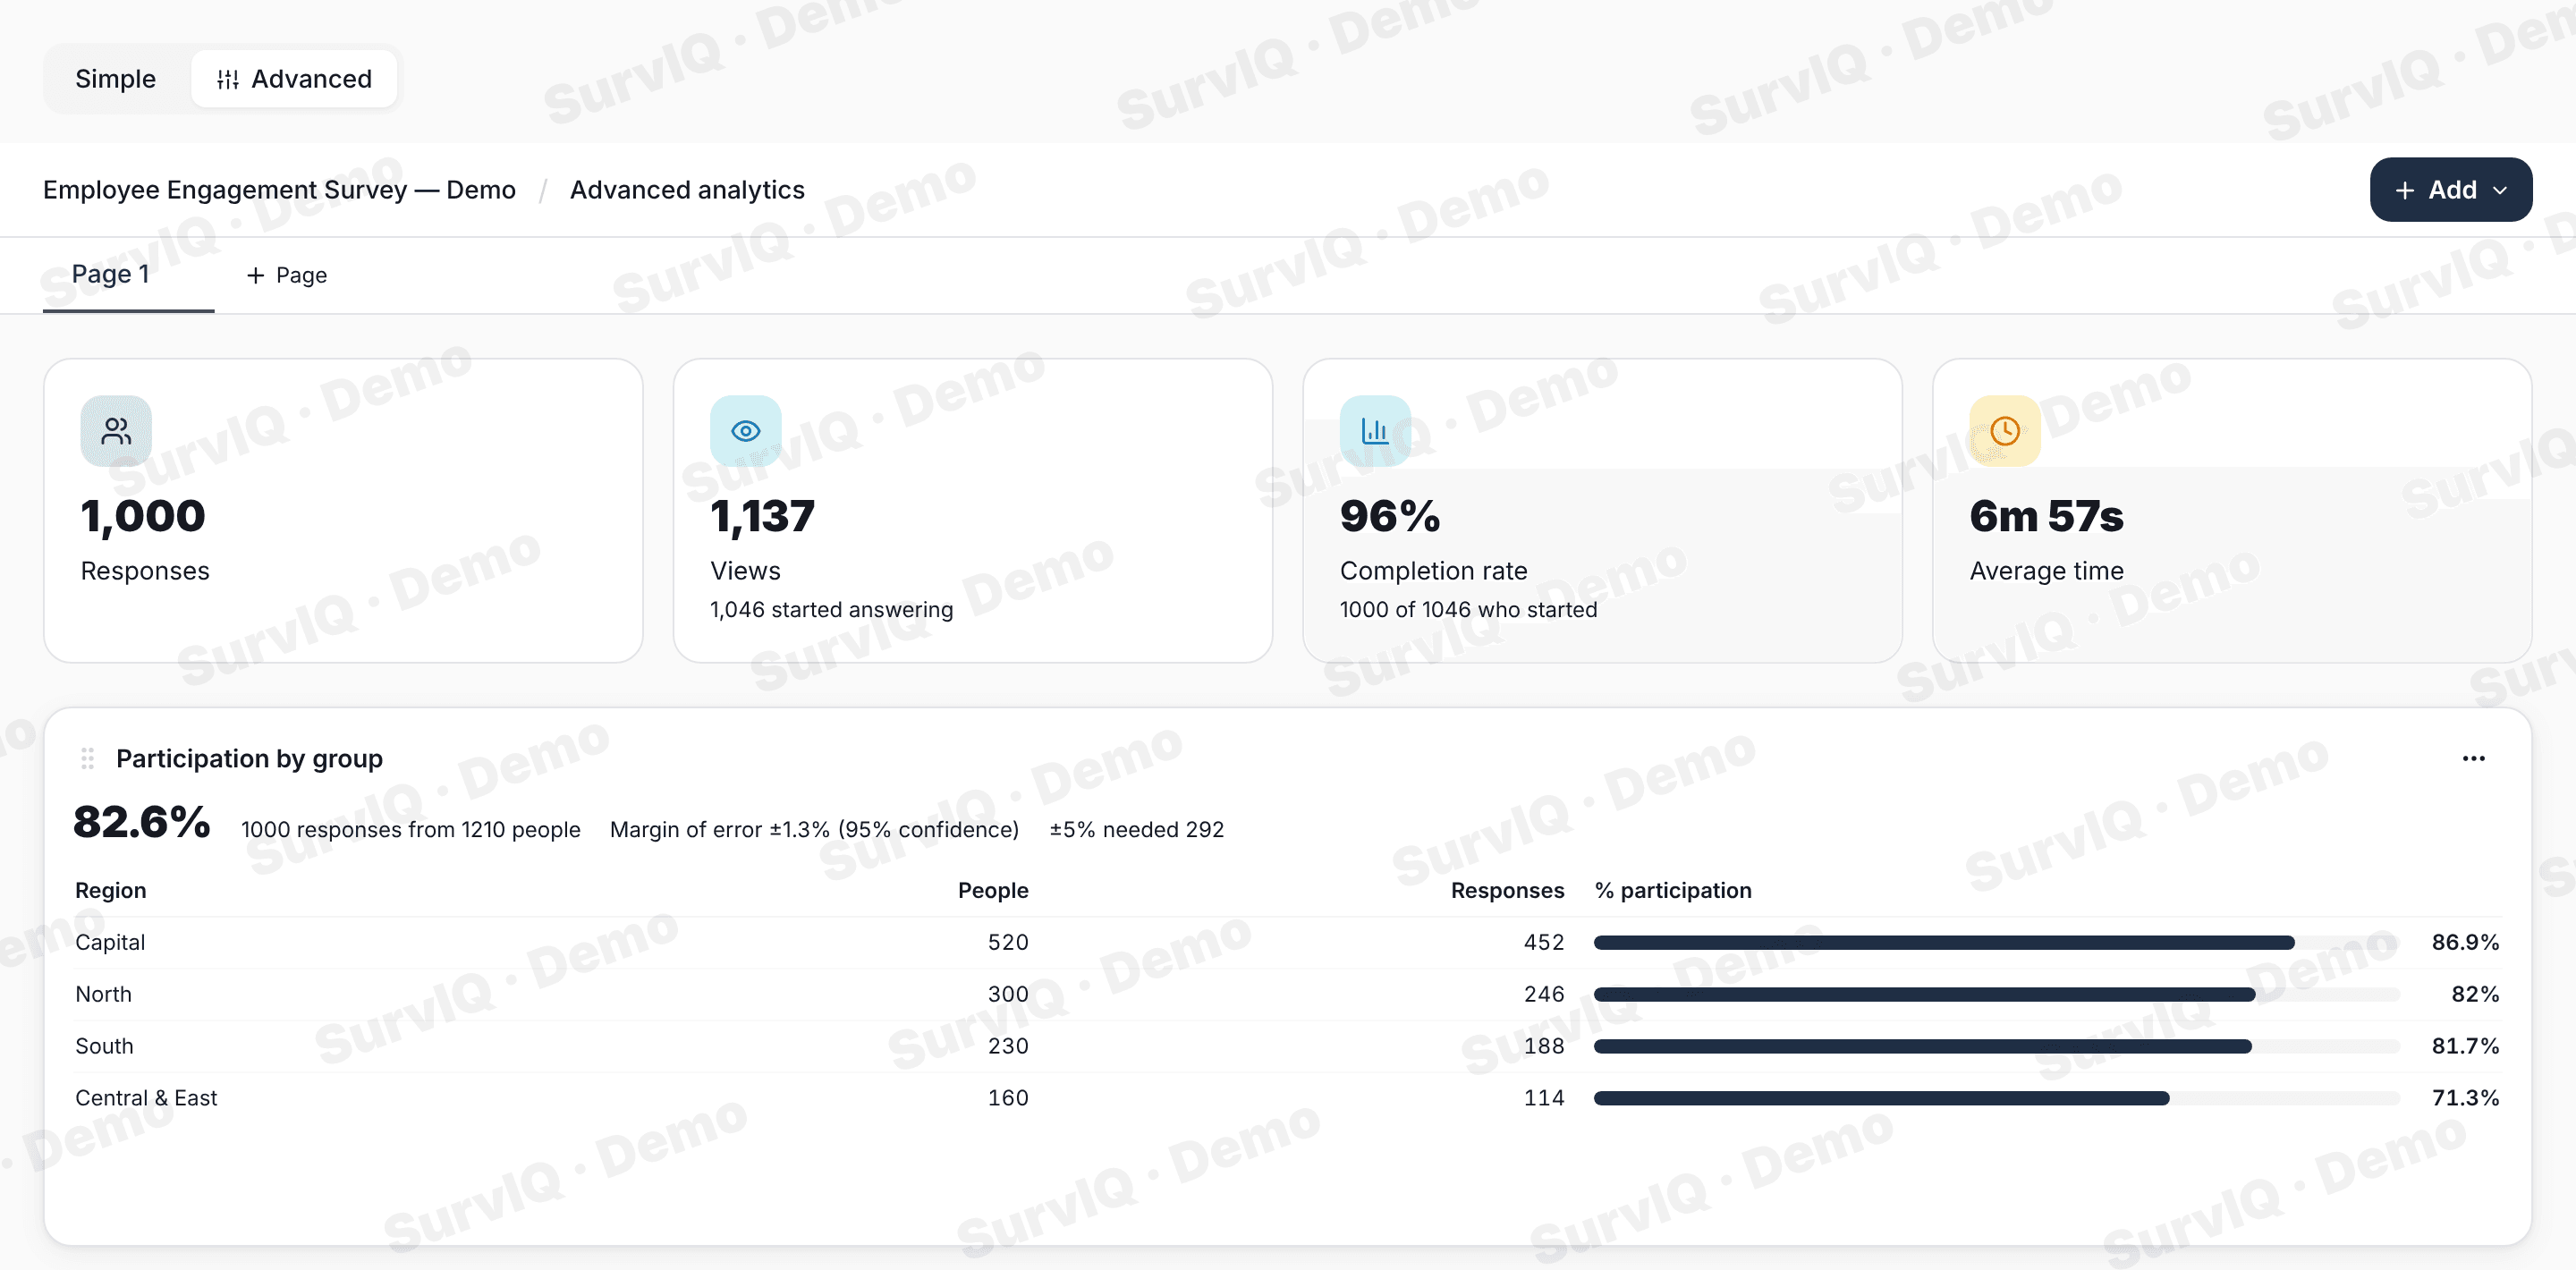
- 1,000 responses out of 1,210 people: ±1.3%.
- A 160-person department with 114 responses: ±4.9% (±9.2% without the correction).
- For ±5% across 1,210 people, 292 responses were enough.
The margin of error only measures the chance of who responded. It doesn't fix bias: if only the happiest people in a department responded, the result will be inflated even with a small margin. That is why you look at each department's participation, not just the total.
How to do it in SurvIQ
In advanced results, Add has Participation by group. Pick the department question (SurvIQ suggests the one that looks like department, office or location), paste the headcount from Excel with two columns, name and number, and you get the table with each department's rate, the total, the margin of error and how many responses you needed.
What to do with low-participation departments
- Show them anyway, with their n visible, so nobody draws conclusions from 4 responses.
- If a department has very few responses, combine it with similar ones into a group ("Other offices") for the charts.
- If the survey is still open, use the table to know where to push: that is the most practical use of participation by department.
The full tutorial:
Participation by department, step by step