How to calculate participation by department
Updated November 18, 2026
In an engagement or internal communication survey, the first thing a client asks is how many people responded in each department. For that you need the headcount of each one. With it, SurvIQ calculates the participation rate per group, the total and the margin of error.
Step 1: add the element
- Open the results and switch to Advanced.
- Tap Add and choose Participation by group.
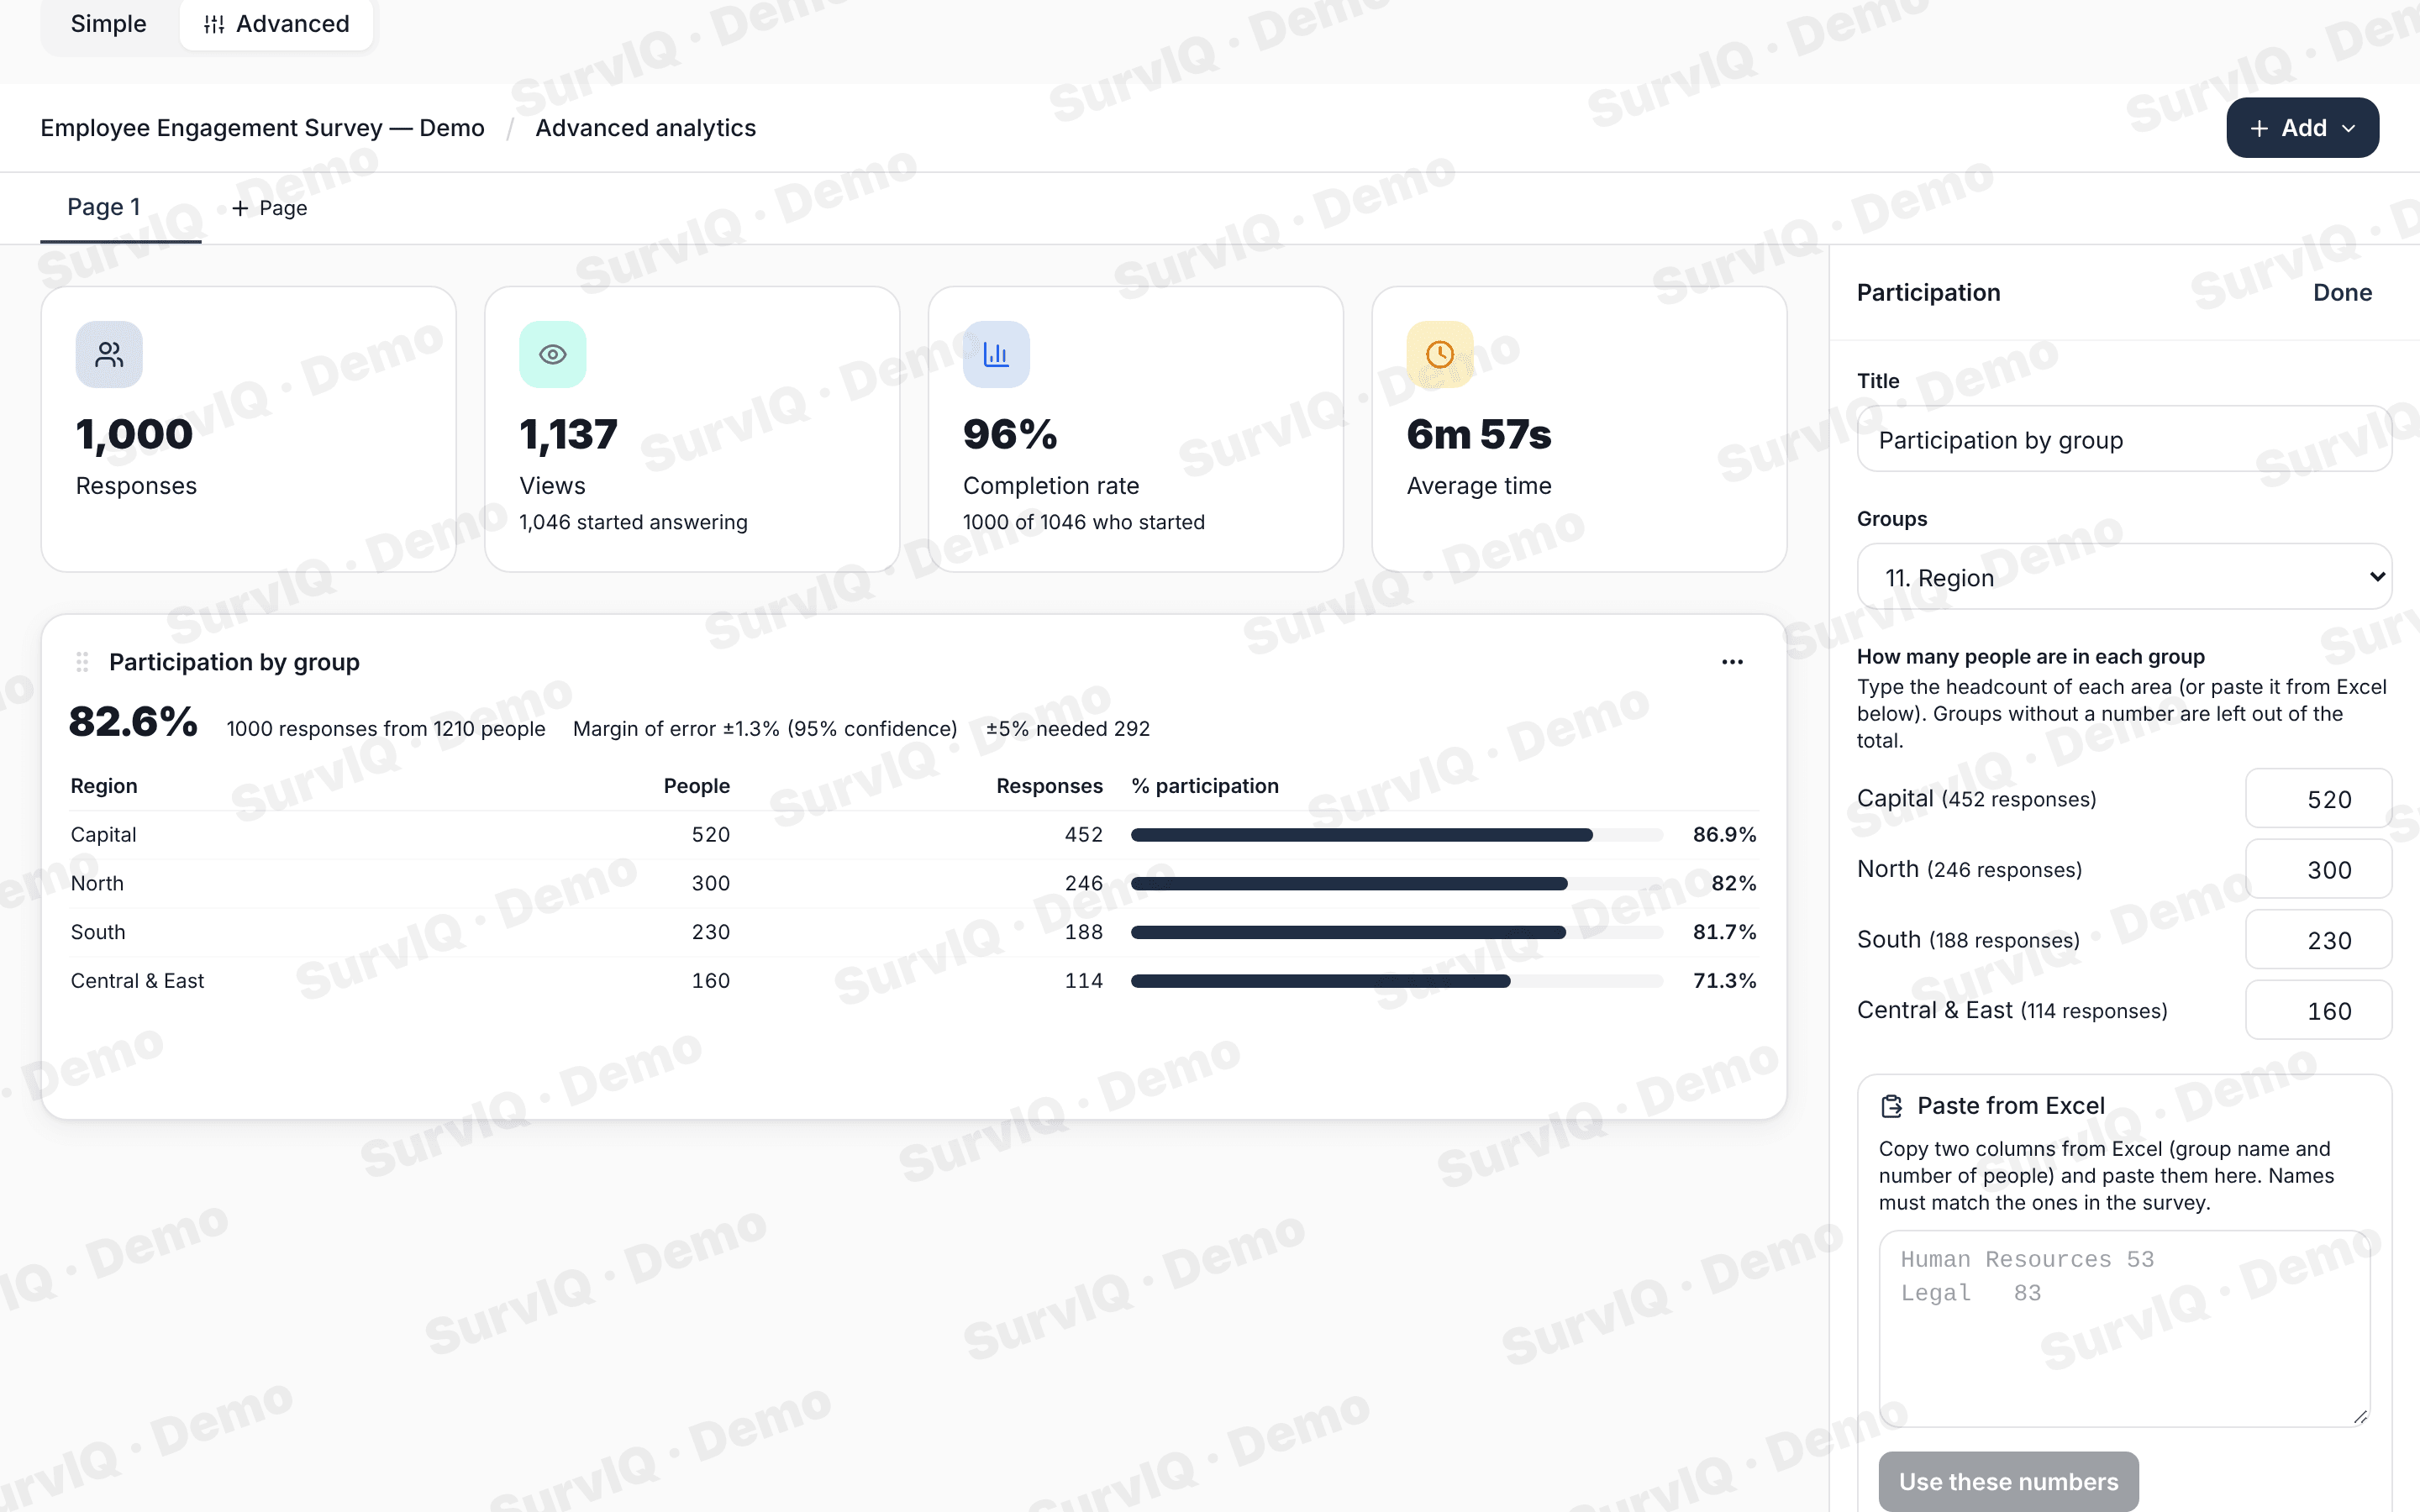
- In Groups, pick the question to split by: department, office, region…
SurvIQ picks the question that looks like department, office or location on its own. You can change it.
Step 2: enter the headcount
Type how many people are in each group, or paste it from Excel:
- In Excel, copy two columns: the group name and the number of people.
- Tap Paste from Excel, paste them and tap Use these numbers.
- Names must match the ones in the survey. If one doesn't, we tell you which.
What it shows
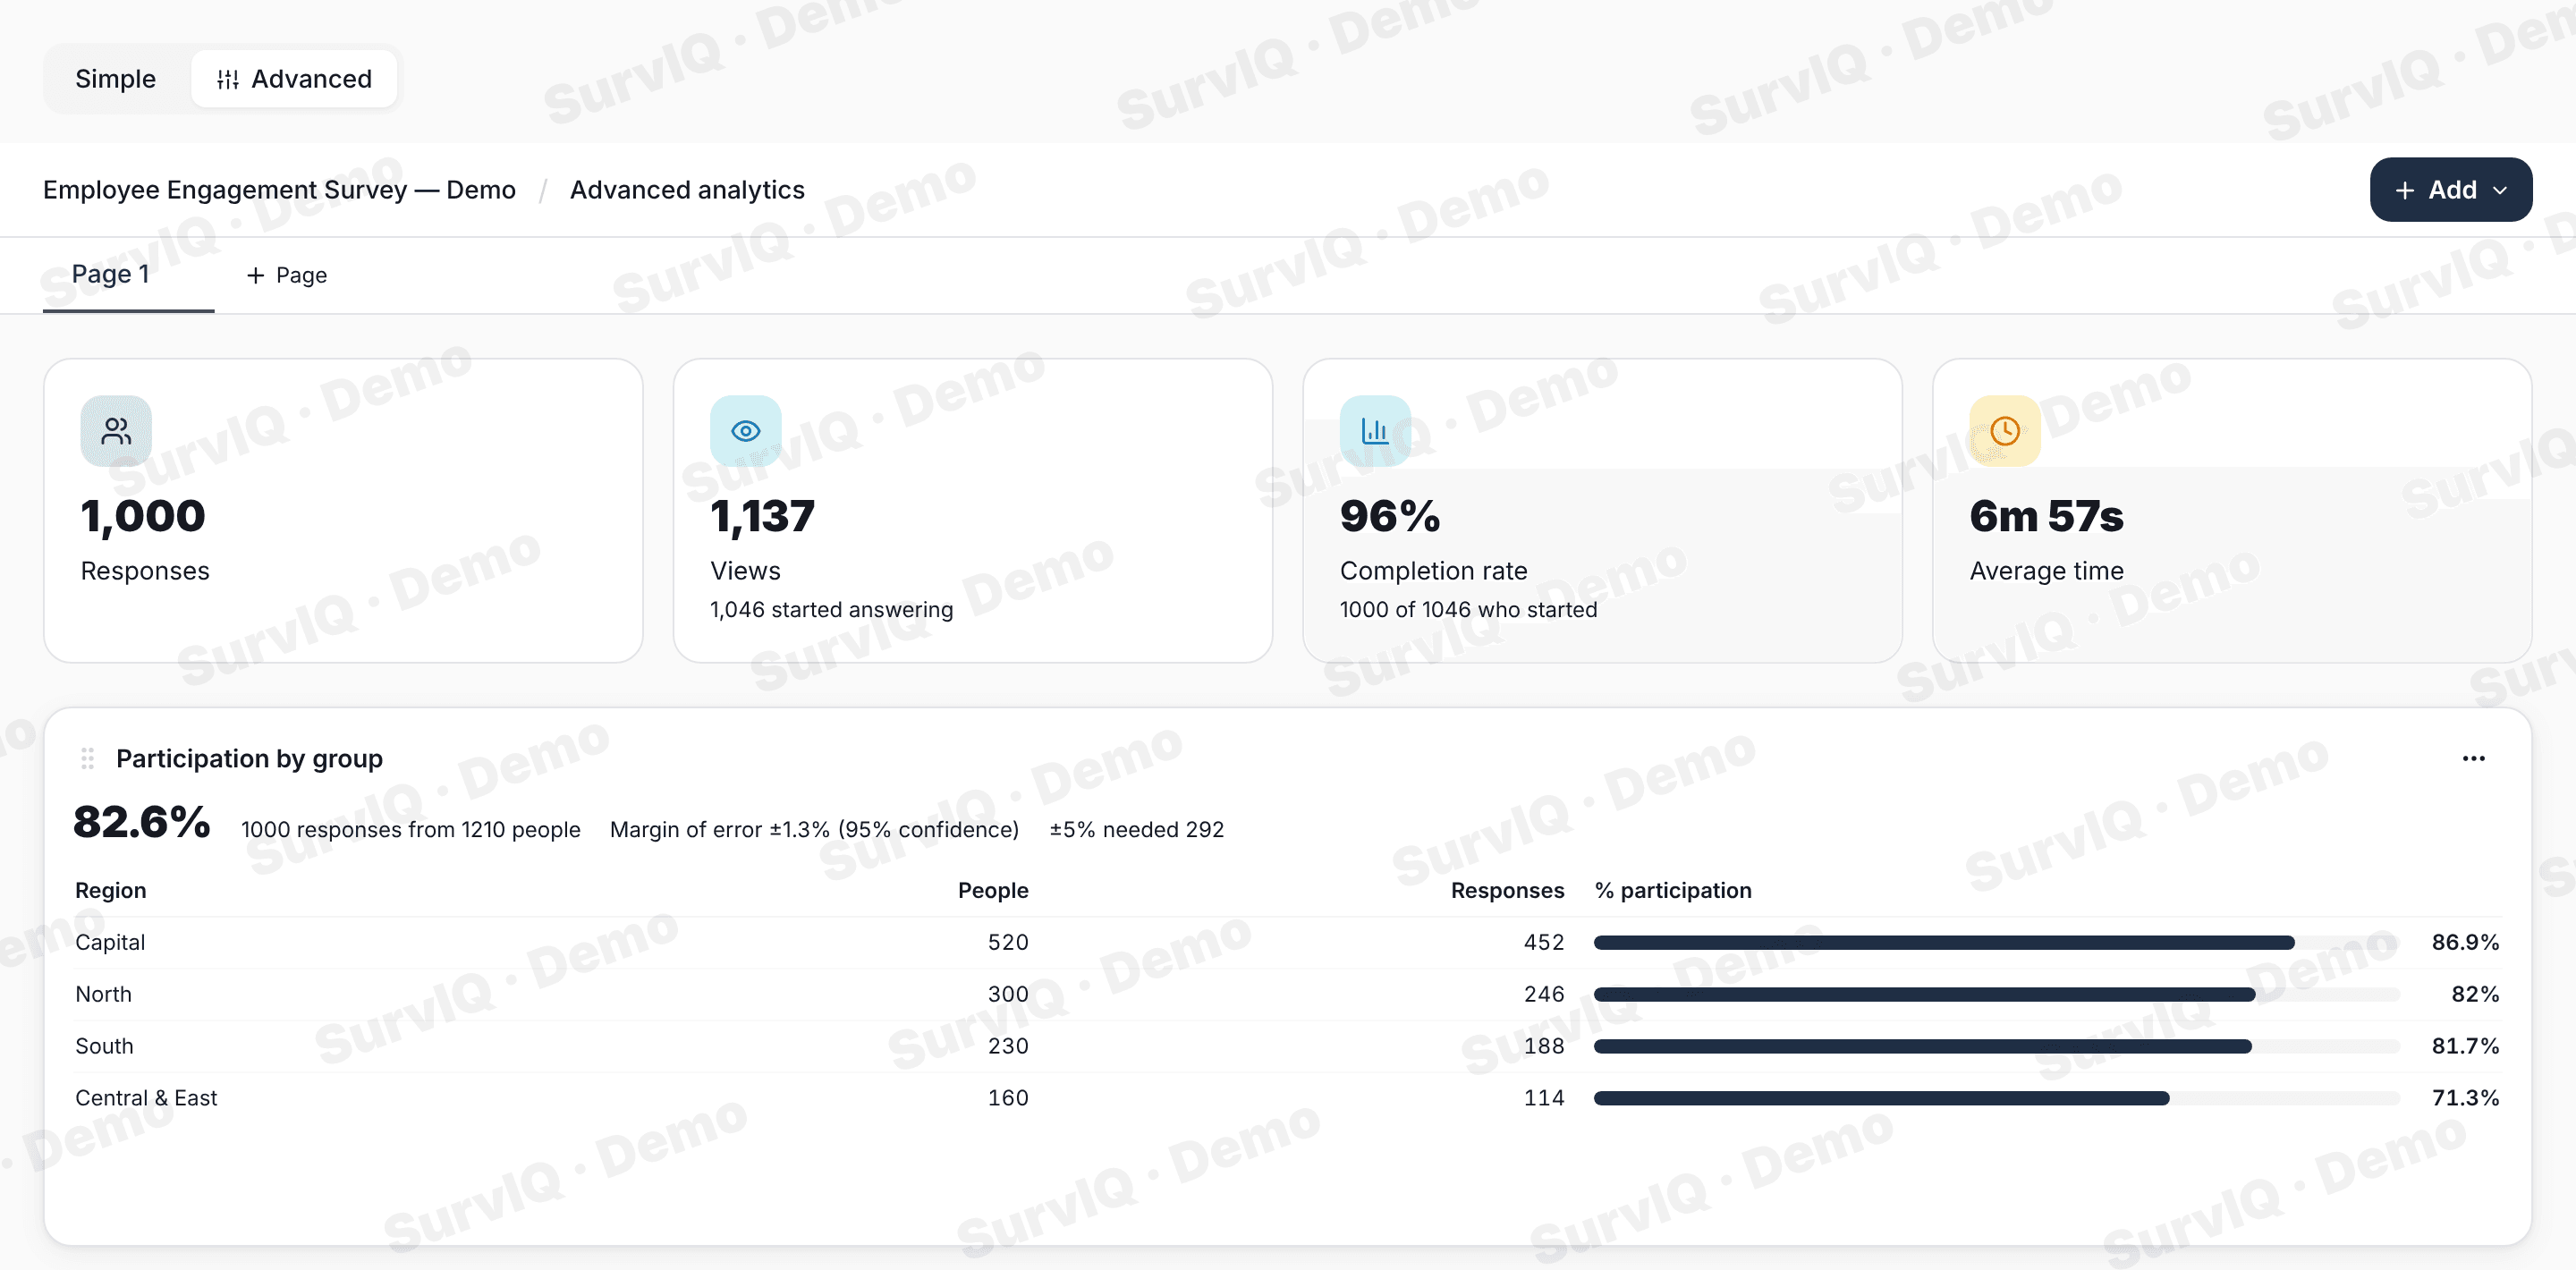
- The overall participation rate and the rate per group, with a bar to compare.
- The margin of error at 95% confidence. Since you know the total headcount, it is adjusted for a finite population: with 82% participation the margin is very small.
- How many responses you needed for a ±5% margin.
- Groups without a number don't count toward the total.
Frequently asked questions
Can I export it?
Yes. It goes into the dashboard PDF and PowerPoint like any other element.
Which plan includes it?
Advanced results are available from the Pro plan.
You can try it with an engagement survey of 1,000 people, no account needed:
Try it in the demo