How to build a factor table by division or department
Updated November 16, 2026
In an engagement or satisfaction survey, questions are usually grouped into factors or dimensions: Leadership, Integrity, Working conditions. This guide shows how to create those factors in SurvIQ and get a table with each factor's average by division, department, site or any other segment.
What a factor is
A factor is the average of several questions for each person. If Integrity is questions 1, 4, 6, 8 and 13, a person's Integrity score is the average of their answers to those five. The table then shows the average of that score in each group.
- Scale questions work (Likert, rating, slider, number), and choice questions with a value per option.
- In a matrix, each row counts as a question. It is worth the chosen column counting from 1: the first column is 1, the second 2, and so on.
- A person counts toward a factor if they answered at least half of its questions.
- Responses are not changed: the factor is calculated when you look at the results.
Step 1: open the Factor table
- Open the survey results and switch to Advanced.
- Tap Add.
- In the "Many at once" group, choose Factor table.
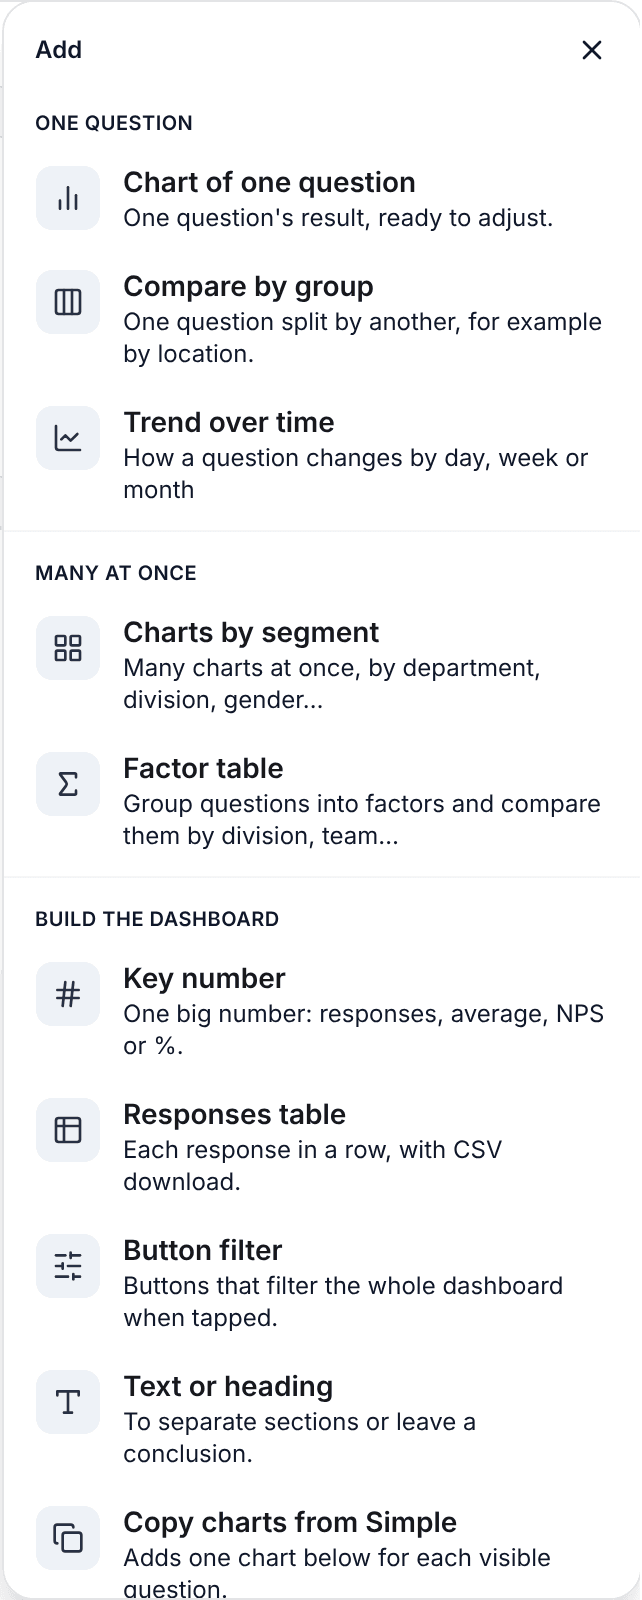
The option shows up when the survey has something to split by: a choice question (for example "Which division do you work in?"), a variable with ranges or a hidden field in the link.
Step 2: create the factors
If the survey has no factors yet, the form to create the first one is already open.
- Type the factor name, for example Engagement.
- Tick the questions that make it up. Matrix rows are grouped under their matrix title, with a button to select them all.
- Tap Save factor. It needs a name and at least 2 questions.
- For the next one, tap Create another factor and repeat.
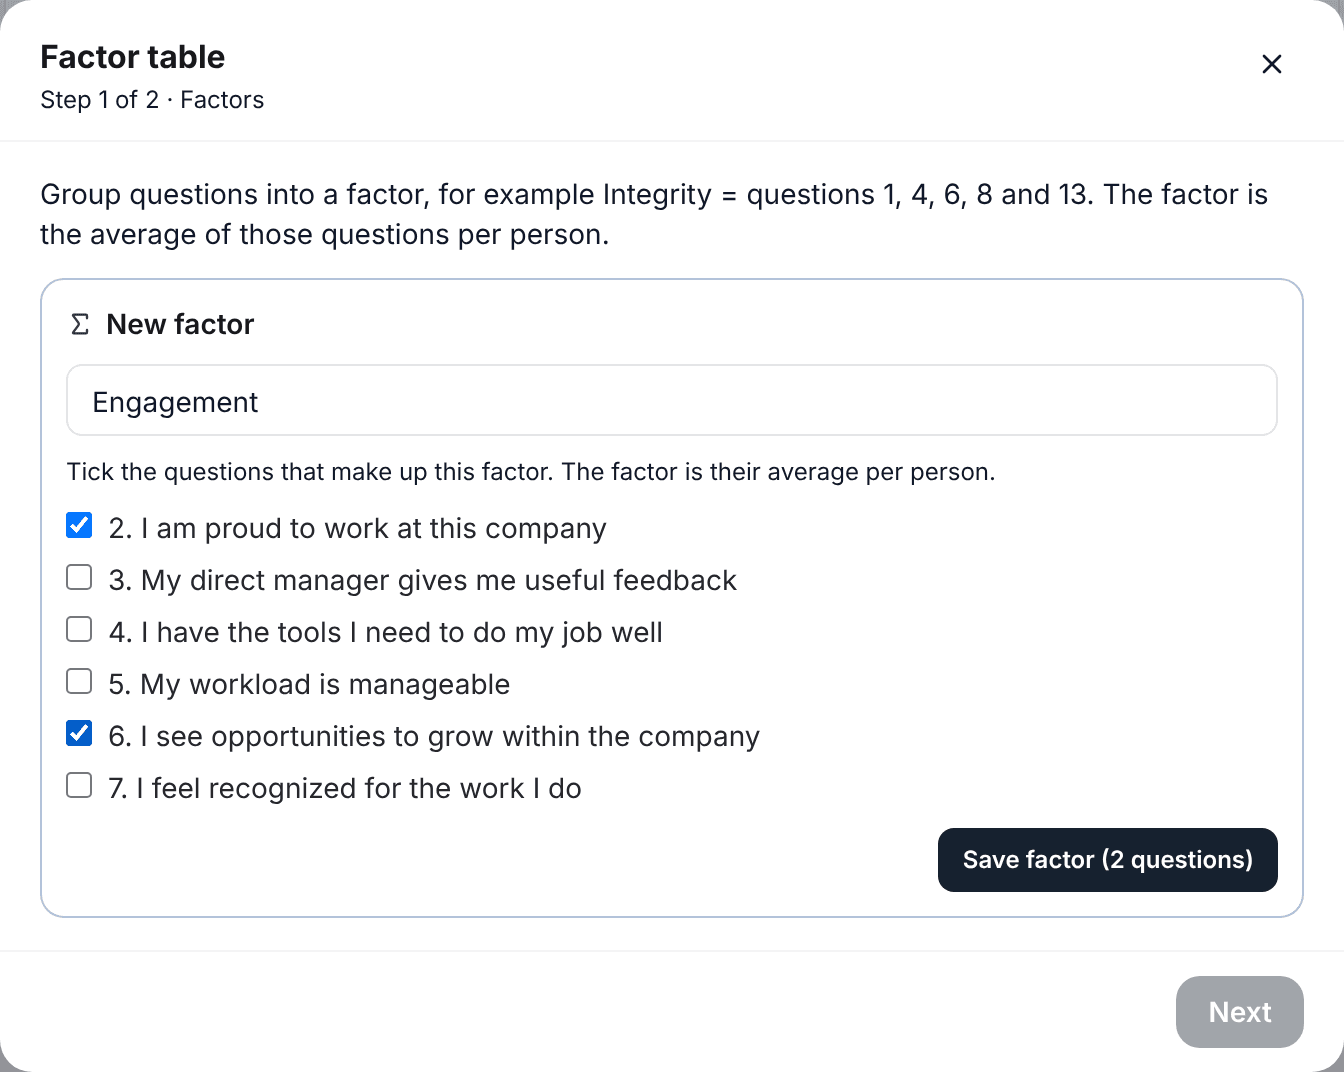
Factors are saved in the survey. Next time you open the Factor table they are already there, and you can also use them in Charts by segment and in filters.
Check, edit or delete a factor
Each factor shows how many questions it has. Tap that number to see the list and check the right ones are there.
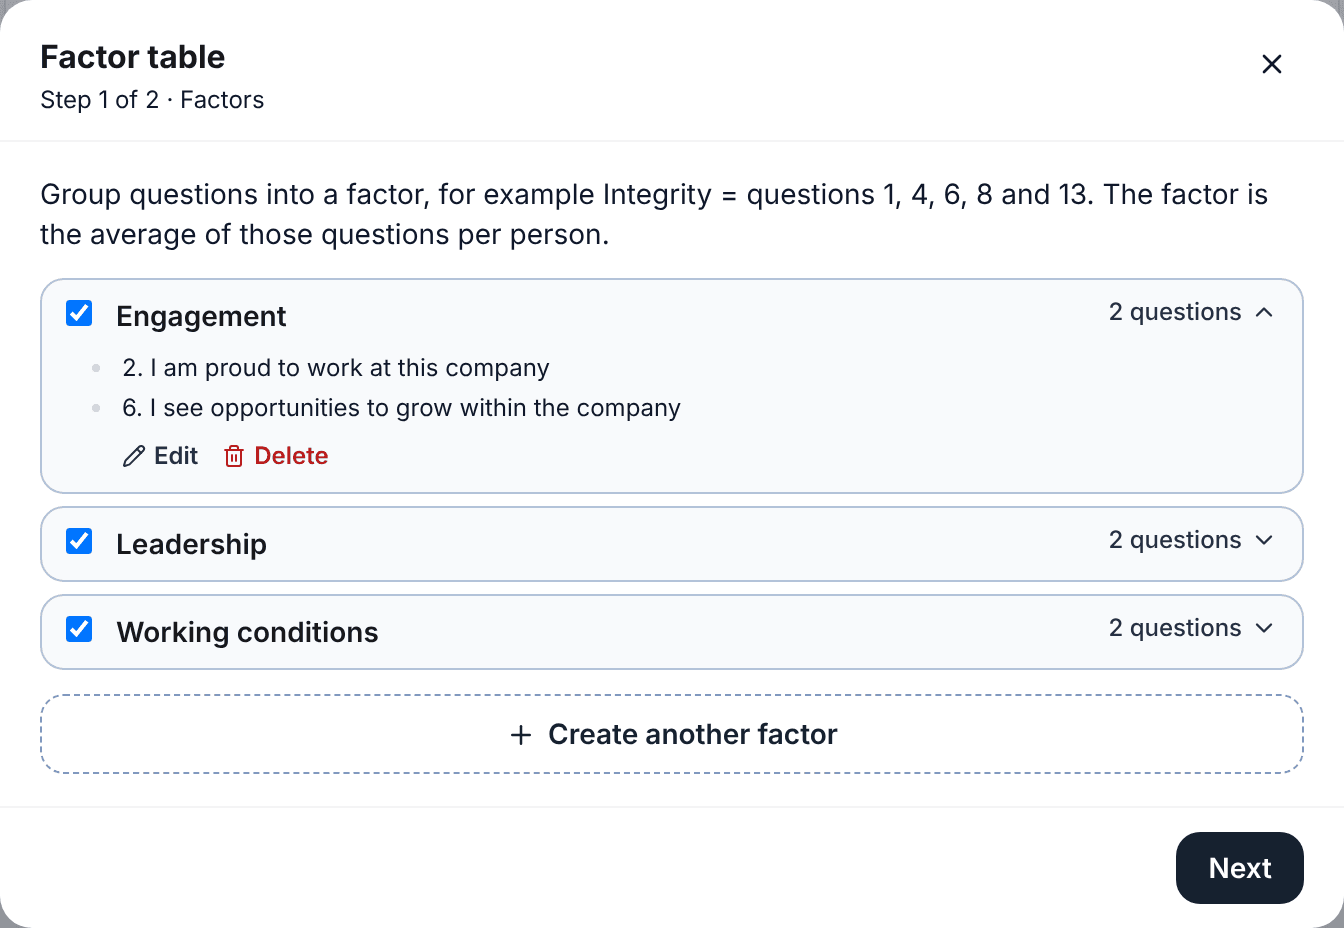
- Edit opens the same form with the name and questions. You can change both.
- Delete asks for confirmation. Tables that used that factor stop showing it. Responses are not touched.
- Tick only the factors you want in the table. The rest stay saved.
Step 3: choose the segment and the table layout
- Tap Next.
- Tick what to split the table by: Division, Department, Region… If you tick several, one table is built for each.
- Choose the layout: one table with every group, or one table per group.
- Tap Create table. It opens on a new dashboard page.
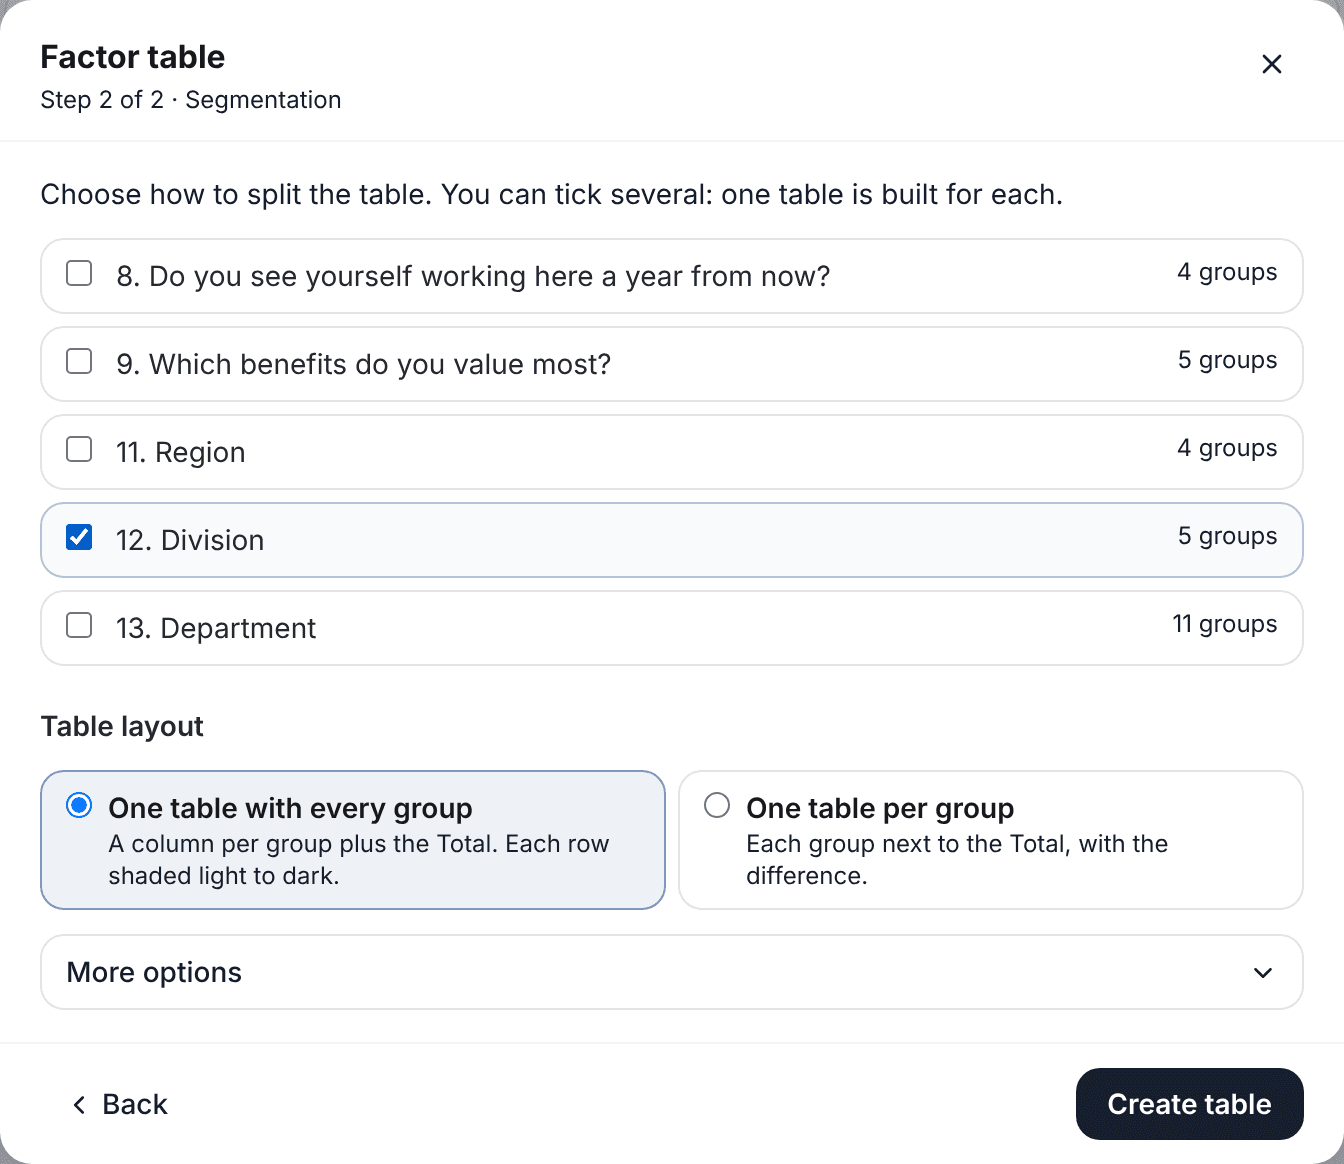
Under More options you will find "Hide groups with fewer than 5 responses". It is on by default to protect anonymity. Turn it off only if you need to see very small groups.
Reading the table with every group
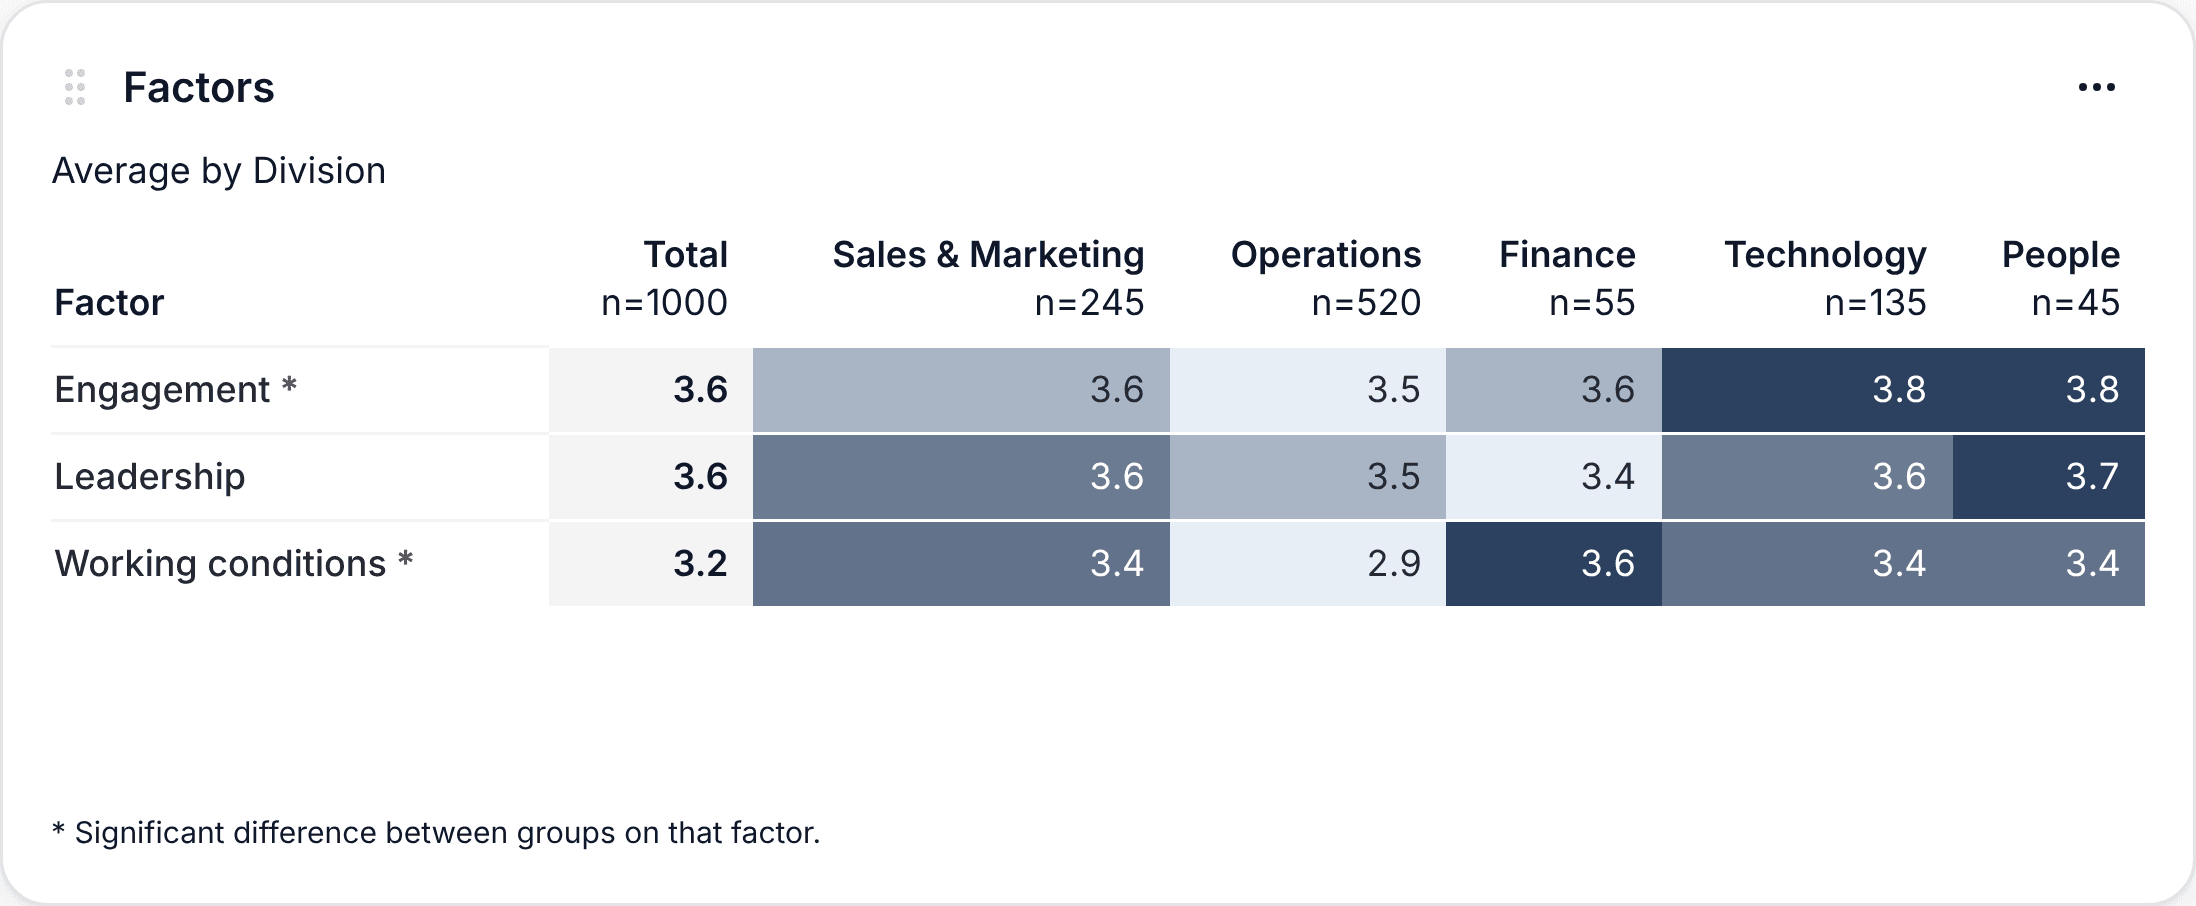
- Each row is a factor and each column a group, with its number of responses (n) under the name.
- The Total comes first, in gray, as a reference.
- Shading goes by row: the lowest group on that factor is light and the highest is dark. You see at a glance where each division sits on each factor.
- An asterisk next to the factor means the difference between groups is significant, so it is unlikely to be chance.
Reading the per-group tables
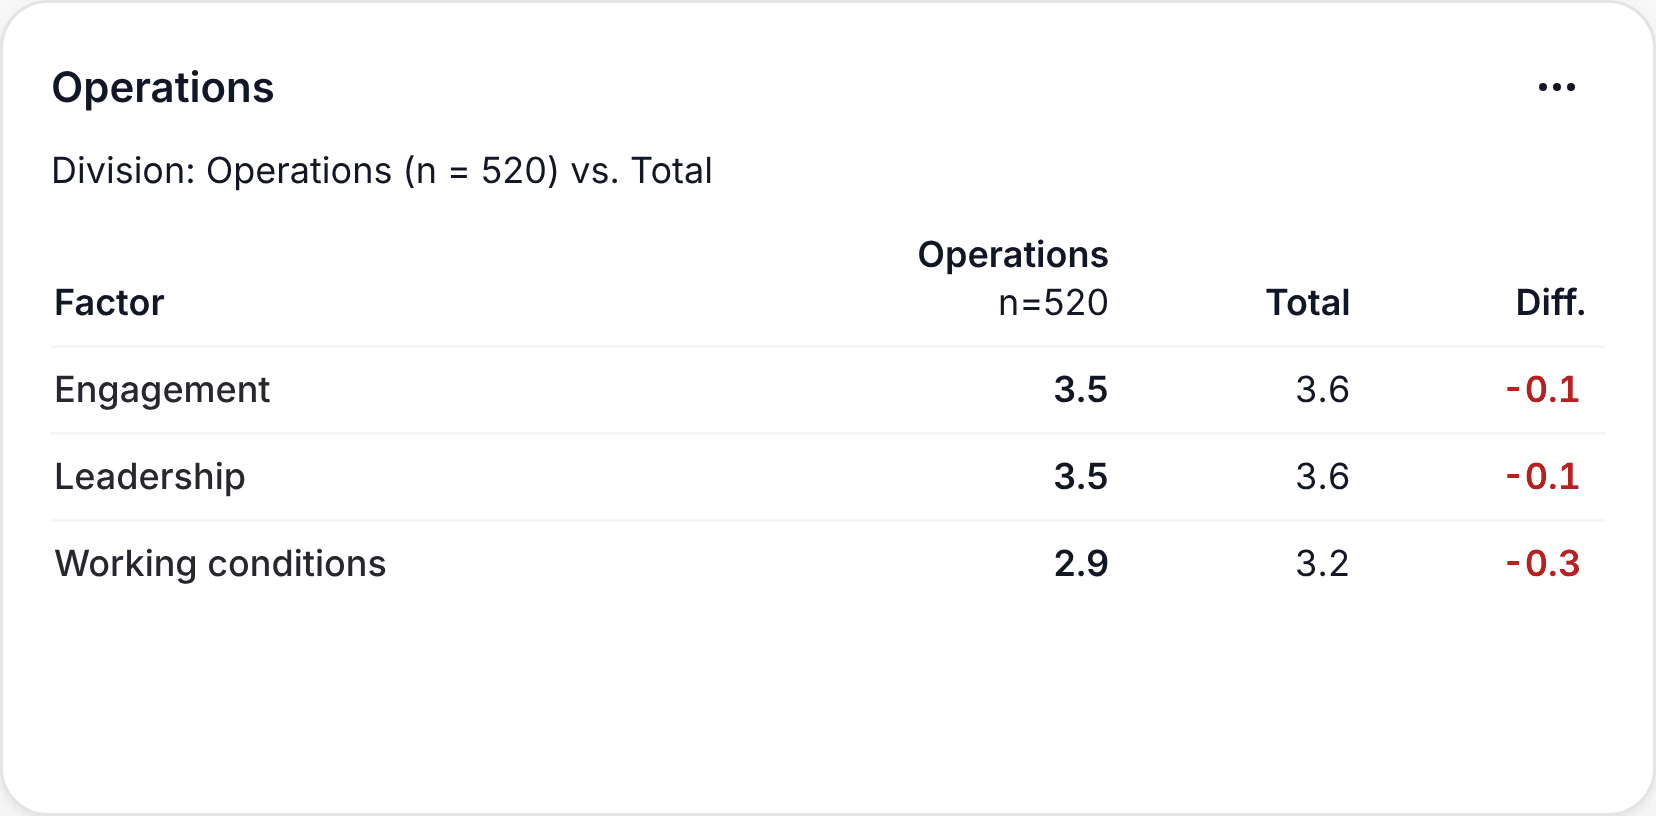
Each group gets its own table with three columns: its average, the Total and the difference. It is handy for giving each manager only their own results. A negative difference shows in red.
Take it to PowerPoint
On the table page, tap Export:
- PowerPoint: each table goes on its own slide.
- One file per group: one PowerPoint per division (or department, or site). The first slide is its factor table against the Total.
Frequently asked questions
What about negatively worded questions?
If a question measures the opposite ("I feel nobody listens to me"), flip it before adding it to a factor: on that question, use Value per option and set 5 = 1, 4 = 2… 1 = 5. That way a high value is always better.
And in a matrix?
In a matrix a row is worth the position of the chosen column. Order the columns from worst to best (for example "Strongly disagree" first) so a high number means something good.
Can I mix different scales?
You can, but the average only makes sense if the questions use the same scale. If you mix a 1 to 5 question with a 0 to 10 one, the 0 to 10 one weighs more. Use questions with the same scale in each factor.
Do factors change the responses?
No. A factor is a calculation on top of the responses. You can edit or delete it whenever you want without losing anything.
You can try the Factor table with an engagement survey of 1,000 people, no account needed:
Try it in the demo